Global broadband subscribers – forecasts and models for top markets
- Oliver Johnson & Jolanta Stanke

- Oct 9, 2023
- 8 min read
By 2030 we are projecting a total of 1.38 billion subscribers to a fixed line service in the top 30 broadband markets in the world.
Full fibre is already dominating the world market and as the decade passes FTTP will be the preferred option for most consumers. Where it is available.
Split by technology we estimate that by 2030 there will be 1 billion FTTP, 164 million cable, 160 million FTTX and only 40M DSL lines in these markets.

While we see some more growth from FTTX (where fibre is present in the local loop with copper, Fibre to the cabinet most often) over the next seven years. That increase is from new subscribers in under penetrated markets on legacy infrastructure. It will also be a low cost option where there are other technologies available as it offers enough bandwidth for many users today.
Cable, an imprecise term, is used as a proxy for those legacy operators (e.g. VMO2, Cox, Time Warner) that still have significant networks based on coaxial cable, almost al DOCSIS3 and 3.1. This base is being swapped out now, replaced incrementally with full fibre, and as DOCSIS4 is on the horizon the overall capabilities match FTTH with XGPON.
DSL will continue to decline. Although a slower and less reliable service it can provide enough bandwidth, again at a low price, that some single person or older households will see little reason to change. Some will not have the choice however as those with access to two or more technology options will not be the entire population.
Regional breakdown
Full fibre will dominate subscriber growth almost everywhere. It is already the market leader in 3 out of 5 regions and will achieve the same distinction in the Americas by the end of 2025.

Regionally Asia dominates in total numbers, with China, Indonesia and others all with large populations and potential subscribers, although mobile plays a large role in those markets. That is true too in much of Africa where fixed infrastructure is more limited.
Europe is expected to have the highest regional FTTP penetration by 2030 with over 90% of households and businesses subscribing to a service.
In Asia progress is rapid in many markets although there is a larger spread of outcomes expected with some countries still making use of copper. While markets like the US will have high take-up of gigabit capable fixed broadband the strength of the ‘cable’ sector means that FTTP will have a lower market share than much of Europe and Asia.
By 2030 we project that most of the world will be above 50% fixed line penetration.

For FTTP, the dominant technology by 2030, there will be fixed lines at well over 40% in most markets and very high market share in many.

Today, in 2023, there is widespread adoption of a broadband line but we can see that FTTP still averages under 50% in most regions.

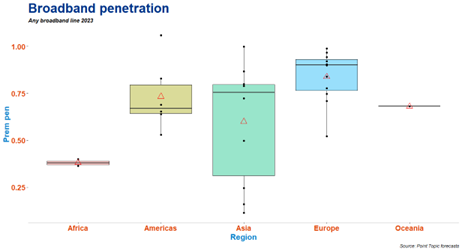

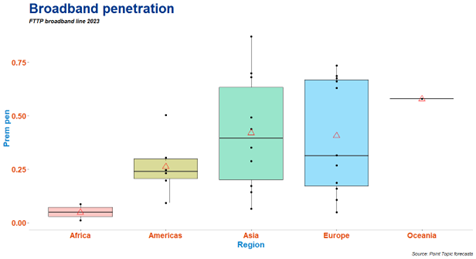
NB different y-axes on the two charts above
Countries and growth
All countries will see higher broadband penetration around the world by the end of the decade. China will of course be the largest market.
A word of caution however. In the official Chinese data, while the reporting seems very clear and there are some very useful looking metrics, we have difficulty reconciling the total number of broadband lines with the estimated number of ‘households’ and business premises.
China has a total population of 1.4 billion and approximately 525 million households (data from 2021) and the report above quotes 590 million fixed line subscribers (Dec 2022).
Again from the report (pg 15) you would expect the number of households with a fixed line to be of the order of 390 to 400 million (75.6% of 525 million) assuming one line maximum per household and conflating adoption by netizens with household lines. This would mean 130+ million fixed line subscriptions would be ‘business’ or non-residential.
Nonetheless, China Is the largest broadband market today and at the end of the decade.

So, the remaining markets in our Top 30 look like this with India with the lowest penetration (27%) and the most (fixed) market potentially available while Korea will be almost homogenous in technology adoption and coverage terms.
The headroom and therefore easier growth will shrink everywhere. Most of the customers will already have internet access of some sort and they will tend to be stickier than a new convert.

For the individual country/technology combinations we project that FTTP/H will dominate in almost all markets. The exception is the US, where a well established cable network and set of operators will still be the market leader. Cable will be getting its own series of upgrades in the next few years as Docsis3.1 and then Docsis4 propagate across the operator footprints.

‘Full’ fibre – the future proof future
As we can see FTTP/H will be the expanding market at the cost of the other technologies. We have been tracking FTTP around the world since the start of 2010 and this allow us to produce more accurate projections with good timelines to train models on.
The general shift to FTTP across all markets will mean replacing lots of copper and co-axial cable with fibre. As the decade progresses the limited amount of headroom left (customers new to broadband) will mean many countries will have markets focused on churn and segmenting the customer base.

China’s rise is plain in this format and the comparative size of the market. We can see flat curves in many of the mature markets in Asia (Japan, Korea, Taiwan) where FTTP has been available for some time. India and Indonesia are two of the potentially most active markets in the second half of the decade.
In Europe there are no fully mature FTTP markets, so there is still space to churn subscribers from other technology services but less headroom in terms of new subscribers in those markets.

The Americas, dominated by the US in FTTP terms indicates an active second half of the decade. While the cable market will restrict total numbers of FTTP in North America there are still plenty of customers to go for and in South America the potential is even greater, although spread across several countries.

As noted, Australia is on its own in Oceania as far as our analysis is concerned. Some of the reporting from Australia is a little unclear when it comes to ‘full fibre’ with FTTN and FTTC included at times in the totals. For sure however the jump from 2019/20 represents higher bandwidths but not necessarily ‘full’ fibre.
This has been echoed around the world with consumers seeking more bandwidth as working from home and general life has become more online and more frequent.

Growth in new customers will slow and the change in many countries will be in the technologies adopted and churned to. South Korea, with very high penetration and almost no ‘new’ market left, and India with lots of potential for new fixed line customers are the outliers.

Slower FTTP adoption can be partly due to slow deployment but we believe that passes quickly and the choice and/or alternative technologies has more of an effect. In particular FTTX, which is a deeply entrenched and mature technology in certain markets, is a barrier as consumers are difficult to churn when they have an adequate service.


Legacy infrastructure in the UK, Italy and Germany is responsible for slower take-up of FTTP and slower deployment as operators need a longer timeframe to recoup their costs and start to make a profit.
FTTX can service the needs of a significant part of the market, who can ‘make do’ with 40-80Mbps quite happily today and we still see users on lower speed (10Mbps) xDSL lines.
One problem for the operators is that growth in monthly consumption is slowing and upward pressure on peak bandwidth is not as extreme as heavy users are migrating to full fibre leaving the less voracious consumers on FTTX or xDSL.
A consequence of this are low cost, lower bandwidth full fibre options. Entry level 20Mbps services are available in many markets.

Copper will gradually disappear but even in those markets where we have sight of a ‘copper switch off’ there will still be legacy subscriptions. We see a sharp drop projected in the UK; it could be even steeper in practice and we will watch keenly. As yet there is not much clarity from other countries and markets on when copper will exit the networks.
Broadband and the future
More fixed lines in more countries and increasing dominance of full fibre is the primary take-away.
There are uncertainties, in particular the ongoing impact of mobile services offering higher bandwidths. We have seen a number of new generation mobile technologies in the last 15 years, and while there is an impact on fixed line subscriptions with each Generation, the general rule seems to be that the cost and consistent speed advantages of fixed line have withstood the challenge.
However in markets where there is less fixed infrastructure, and less prospect of deployment, mobile and even satellite will find market share.
Overall growth has slowed, we passed the global point of inflexion a few years ago now, but what does this mean for the world?
Of course it depends on perspective:
Telecoms operators and kit manufacturers will still find plenty of profit potential with customers churning and new networks, or network upgrades. It will be tighter than ever however and much of the action today comes from companies trying to stake a claim and be a ‘first mover’, at least in full fibre terms.
Governments and policy makers welcome high bandwidth networks but do not want to pay for them. Typically they will try and manage and regulate the market so that as much of the population as possible gets access to choice and preferably full fibre. This will serve for most markets for between 70% and 80% of premises and subsidies and alternative technologies will fill the gaps. However more bandwidth means more GDP and a host of other advantages, so the progressive states will push hard to achieve high bandwidth, low cost outcomes.
Customer demand for bandwidth shows signs of slowing. Video, which has traditionally been the most dominant traffic on networks, is now well within scope for full fibre, at least at the current resolutions (and to date 8K TV sales are slow). More life will be online or dependent on internet access and that will have consequences.
The Digital Divide persists and while it is narrower than ever, more people are online and variances in technology availability are gradually eroding, there are still going to be people who are excluded and that exclusion is getting deeper.
The stages of Digital Deprivation. Every household with internet and broadband access doesn’t solve all the issues for access however. More to come in our next publications.

Sources and methodology
We have forecast fixed broadband subscribers by technology in the top 30 global markets1 for the period ending Q4 2030. The aim of the forecast is to predict which broadband technologies will come to dominate in the largest broadband markets, perhaps at the expense of other fixed or mobile technologies.
The main input to the forecast is Point Topic’s Global Broadband Subscriber (GBS) data, collected and estimated quarterly at the operator and country level. For the purposes of this forecast we used the GBS data covering the period between Q4 2011 and Q4 2022. Another input was operator and regulator announcements about broadband network deployment plans and targets for the next 5-10 years.
The initial stage of forecasting was completed using one of the three models:
Logarithmic function: ln_x = np.log(x)
Logistic function: L / (1 + np.exp(-k*(x-x0)))
Gompertz function: a * np.exp(-b * np.exp(-c * x))
For each country and technology combination we selected one of the three models that best fit the existing data and trends in broadband subscriber figures.
In the next stage, the model outputs were adjusted, where necessary, taking into account network deployment announcements and the number of premises in a country (upper limit). The forecast number premises was based on the UN population estimates and projections2 and UN Household Size and Composition data3.
Technologies covered and caveats
Our forecast covers the main fixed broadband technologies:
DSL (mainly ADSL but including VDSL in some cases)
Cable (including Docsis3.0 and Docsis 3.1)
FTTH (FTTP)
FTTx (mainly VDSL, but also other variants of fibre-to-the-X)
FWA (some countries only)
Satellite (some countries only)
The variations on which technology group includes VDSL (DSL or FTTx) depend on the reporting be regulators/ operators across the countries.
We forecast FWA and satellite figures only in the countries where they are significant.
For more details and caveats consult the following table.


Comments