The Geography of Fibre Competition: Why Local Overlap Matters for CMA Approval of nexfibre/Netomnia Merger
- Veronica Speiser

- May 7
- 8 min read
On 23 April, the Competition and Markets Authority (CMA) announced that it was seeking views on the anticipated acquisition of Substantial Group (Netomnia,YouFibre, and Brsk) by Liberty Global, Telefónica and InfraVia, through their joint venture nexfibre. The transaction, which remains at the invitation-to-comment stage until 8 May 2026, has become an early test of how the CMA will assess consolidation in the UK fibre sector under the post-DMCCA merger regime.
At the centre of the debate is CityFibre’s argument that the CMA should assess the deal using a granular local market framework based on overlapping fibre footprints, rather than a national wholesale market definition.
Based on Q1 2026 footprint data, the combined entity would create an FTTP network covering approximately 9.9 million premises across 430,387 postcodes. After accounting for overlap of around 832,000 premises and 34,037 postcodes between Virgin Media O2/nexfibre and Netomnia, the transaction would add approximately 2.2 million incremental premises to Virgin Media’s FTTP footprint, representing an estimated 29% expansion (Table 1). The scale and geographic concentration of those overlaps are likely to play an important role in how the CMA assesses both jurisdiction and potential competition effects at the local level.
Table 1. Footprint Analysis (Mar 2026). Source: Point Topic.
Network | Premises | Postcodes |
Virgin Media O2 fibre* | 7,735,076 | 325,987 |
Netomnia | 3,042,950 | 138,437 |
Overlap | 831,935 | 34,037 |
Combined Footprint | 9,946,091 | 430,387 |
*including their RFOG, XGSPON and Nexfibre premises
Why market definition matters
CityFibre’s opposition to the transaction turns on a single competition law issue: geographic market definition.
The parties are likely to argue that the relevant market is national, with Openreach remaining the dominant wholesale infrastructure provider across the UK. On a national basis, nexfibre and Netomnia remain comparatively modest in scale.
CityFibre’s position is different. Its submission reportedly argues that fibre competition occurs primarily at a local level, where Altnets selectively overbuild each other in specific towns, cities and postcode clusters. On this view, the relevant market is not the UK as a whole, but the individual areas where network footprints overlap and where customers may lose a competing fibre alternative if the merger proceeds.
This distinction matters because under section 23 of the Enterprise Act 2002, the CMA may assert jurisdiction where a merger creates or enhances a 25% share of supply in the UK or in a “substantial part of the UK.” That “substantial part” can include regions, cities or smaller geographic areas.
What the overlap data shows
Granular FTTP overlap data for Q1 2026 provides an indication of how the CMA may approach the issue. The figures show that the overlap between Virgin Media/nexfibre infrastructure and Netomnia footprint is concentrated in particular regions rather than evenly distributed nationally.
Table 2. Regional Concentration Analysis. Source: Point Topic.
Region | Overlap Premises | % of Total Overlap | Postcodes |
North West | 304,455 | 36.6% | 13,383 |
Wales | 109,671 | 13.2% | 4,211 |
West Midlands | 98,583 | 11.8% | 3,746 |
East Midlands | 63,506 | 7.6% | 2,380 |
North East | 56,677 | 6.8% | 2,364 |
Northern Ireland | 55,905 | 6.7% | 1,933 |
Other Regions | 143,138 | 17.1% | 6,020 |
The concentration of overlap in the North West is particularly notable, accounting for more than one-third of the total number of overlapping premises nationally. Wales (13.2%) and the West Midlands (11.8%) also show strong concentrations; these are less concerning in the overall geographic context, but are notable when looking at the competitive landscape within the regions.
From a competition perspective, this supports the argument that the transaction's competitive effects may be experienced unevenly across the UK. In some localities, the merger could reduce the number of independent FTTP competitors more materially than national market share figures alone would suggest.
Retail competition masks infrastructure concentration in overbuild areas
The overlap analysis shows that 34,037 postcodes and ~832k premises are served by both Netomnia YouFibre/brsk and at least one Virgin Media fibre network variant (RFoG, XGSPON or nexfibre). Overall, this suggests a modest level of overbuild between the two suppliers; however, in the competitive landscape within these areas, one could argue that an incumbent supplier duopoly emerges despite several retail ISPs operating there. Table 3 provides insight into operator presence inside the Virgin/nexfibre/Netomnia overbuild areas.
Table 3. Operator Presence in Virgin Media/nexfibre and Netomnia Overbuild by Postcodes. Source: Point Topic.
Operator | Postcodes | Premises | % of Overlap Premises |
Netomnia/YouFibre/brsk | 34,037 | 831,935 | 100% (by definition) |
BT (Openreach) | 34,030 | 831,858 | ~99.99% |
TalkTalk | 33,991 | 931,218 | ~99.91% |
Sky | 33,905 | 829,181 | ~99.67% |
Virgin Media XGSPON | 17,653 | 435,157 | ~52.3% |
Virgin Media RFoG | 8,763 | 221,017 | ~26.6% |
nexfibre Virgin Media | 8,233 | 191,580 | ~23.0% |
Examining these areas further, of the 34,037 overbuilt postcodes, 91.6% (766,554 premises) are classified as "high-competition" areas with 5+ fibre operators.
Table 4. Competition Tier Breakdown of Virgin Media/nexfibre and Netomnia Postcodes. Source: Point Topic.
Competition Tier | Postcodes | Premises | % of Overlap |
High Competition (5+ networks) | 31,173 | 766,554 | 91.6% |
Lower (2 networks) | 2,215 | 47,277 | 6.2% |
Medium (3 networks) | 556 | 13,724 | 1.6% |
Medium-High (4 Networks) | 183 | 4,380 | 0.5% |
At first glance, this might suggest that consumers in these areas benefit from substantial infrastructure competition. However, the composition of those competing operators is important. Table 5 below provides a snapshot view of the competitive landscape within the highly competitive postcodes.
Table 5. Operators Present in "High-Competition" Virgin Media/nexfibre and Netomnia Overlap Areas. Source: Point Topic.
Operators | Postcodes | Premises Covered |
Sky | 31,173 | 766,554 |
Netomnia/YouFibre/brsk | 31,173 | 766,554 |
TalkTalk | 31,173 | 766,554 |
BT | 31,173 | 766,554 |
Virgin Media XGSPON | 16,650 | 412,797 |
Virgin Media RFoG | 8,179 | 207,496 |
nexfibre | 6,918 | 161,310 |
CityFibre | 215 | 4,681 |
BT, Sky, TalkTalk, and Netomnia are ubiquitous across all 31,173 high-competition postcodes. This is significant when BT, Sky, and TalkTalk primarily resell Openreach infrastructure in these areas.
This distinction is likely to be central to any CMA assessment. Although multiple retail brands may be visible to consumers, much of the underlying infrastructure competition may, in practice, reduce to Openreach-based networks and Virgin Media/nexfibre/Netomnia infrastructure.
From a competition policy perspective, the merger could therefore reduce the number of genuinely independent FTTP infrastructures in certain areas, even where retail choice remains numerically high.
The transaction may reduce infrastructure competition in already saturated markets
The overlap data also indicates that these areas are mature, highly penetrated broadband markets, with residential take-up of approximately 88.5%. Virgin Media already holds a 46.4% share of active lines through its legacy cable base, BT retains a combined ~22% share across its FTTP and FTTC accesses, with Netomnia/YouFibre’s retail share remaining comparatively small.
This suggests that future competition is unlikely to be driven by connecting previously unserved homes. Instead, competition increasingly centres on customer switching, pricing pressure, service differentiation, and migration from legacy broadband technologies to full fibre.
If Netomnia is absorbed into the Virgin Media/nexfibre ecosystem, consumers in overlapping areas could see reduced infrastructure-level competition, less aggressive pricing or promotional activity over time, lower pressure for network upgrades and service innovation, and reduced long-term competitive tension between independent fibre builders
This is particularly relevant in areas such as the North West, Wales and parts of the Midlands, where "high-competition" and overlap intensity are highest.
Table 6. "High-Competition" Areas versus Virgin Media/nexfibre and Netomnia Overbuild by Region. Source: Point Topic.
Region | Number of High-Competition Postcodes | Average Number of FTTP Operators | Number of Premises Overbuilt by VMO2/nexfibre/Netomnia | % of Total Combined Network Overbuild |
North West | 12,680 | 5.1 | 304,455 | 36.6% |
Wales | 4,088 | 5.0 | 109,671 | 13.2% |
West Midlands | 3,308 | 5.1 | 98,583 | 11.8% |
Northern Ireland | 1,905 | 5.1 | 55,905 | 6.7% |
North East | 1,899 | 5.0 | 56,677 | 6.8% |
East Midlands | 1,800 | 5.3 | 63,506 | 7.6% |
Other Regions | 5,493 | 5.1 | 143,138 | 17.1% |
The geographic concentration of fibre overbuild strengthens the case for local market analysis
The overlap analysis indicates that fibre competition is highly concentrated geographically rather than evenly distributed nationally. The North West alone accounts for approximately 40% of all high-competition overlap premises, with Wales representing the second-largest concentration. Major urban authorities, including Liverpool, Manchester, Birmingham and Belfast, contain particularly dense clusters of competing FTTP infrastructure.
Liverpool and Manchester represent the largest areas of direct overlap between Virgin Media/nexfibre and Netomnia networks in the North West, with approximately 81,338 and 80,490 overbuilt premises, respectively. Significant concentrations are also present in Sefton (22,880 premises), Wigan (15,868 premises) and Cumberland (15,589 premises). These concentrations provide a practical illustration of the localised nature of fibre competition that sits at the centre of the CMA’s market definition debate.
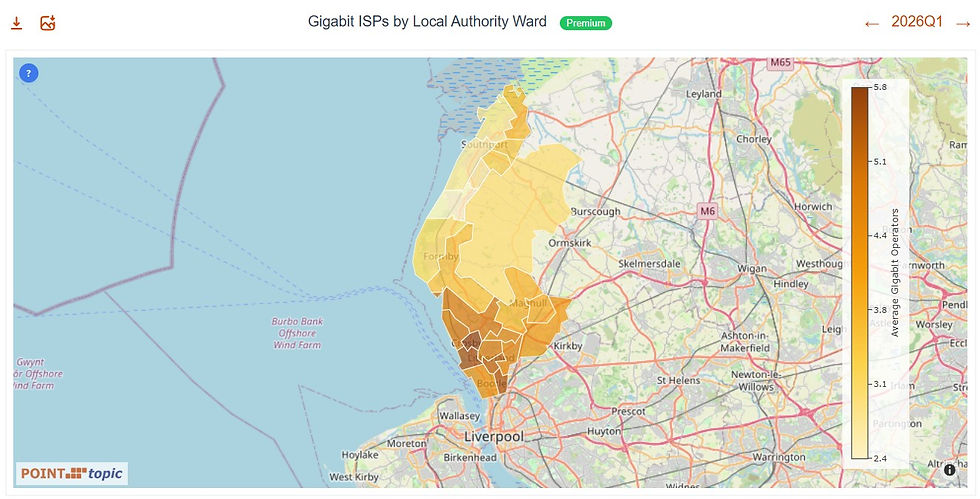
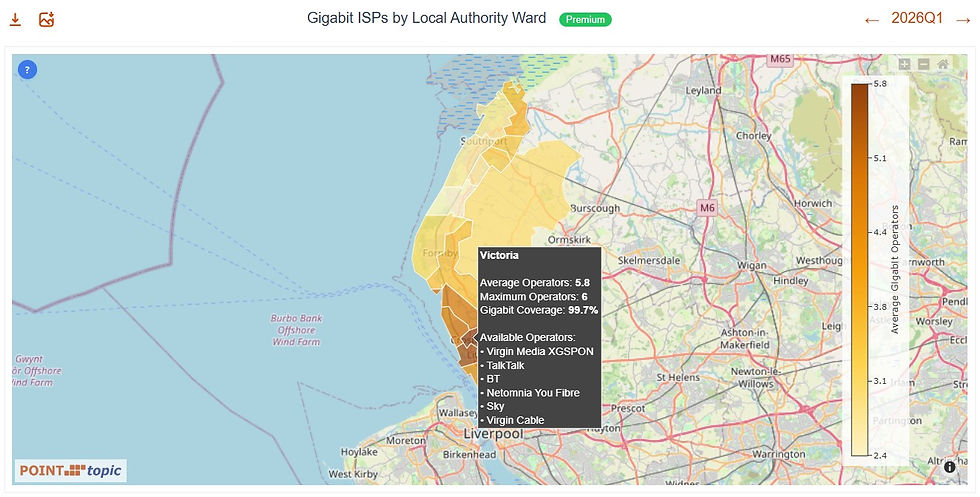
The Local Authority mapping for Sefton in Figures 1 and 2 illustrates the distinction between retail broadband choice and underlying infrastructure competition. At first sight, the area appears highly competitive, with wards averaging five to six gigabit-capable operators.
However, closer inspection of the operator composition reveals that much of this apparent competition is driven by retail providers operating over Openreach infrastructure. In practice, consumers in many wards are choosing primarily between Openreach-based retail providers such as Sky, BT and TalkTalk, and the competing Virgin Media/nexfibre and Netomnia fibre networks.
This distinction may become significant in the CMA’s assessment. While retail brand choice remains extensive, the number of independent physical FTTP infrastructures is materially lower than the headline operator count suggests.
A similar pattern emerges from the Wigan infrastructure footprint analysis shown in Figures 3 and 4. Several wards display infrastructure density levels exceeding 250% of premises coverage, indicating substantial network duplication between Openreach, Virgin Media and Netomnia within the same geographic areas.
For example, the Golborne & Lowton West ward shows:
Openreach coverage of 99.9% of premises,
Netomnia coverage of 84.6%,
and Virgin Media coverage of 82.3%.
This level of overbuild demonstrates that multiple full fibre infrastructures are competing directly for the same households in highly saturated broadband markets. From a competition perspective, these are precisely the types of local markets where the CMA may examine whether the merger reduces infrastructure competition, even if multiple retail broadband brands remain available after the transaction.


Looking at Cumberland, the overbuild matrix in Figure 5 further reinforces the extent of infrastructure overlap among the Openreach, Virgin Media, and Netomnia networks. The data indicates that Netomnia overlaps with Openreach FTTP across almost its entire footprint, while also overlapping substantially with Virgin Media’s newer FTTP deployments and nexfibre build areas.

This demonstrates that the transaction is not simply combining geographically complementary assets. In a number of local markets, the parties are already engaged in direct infrastructure competition over the same premises.
Conclusion
The nexfibre/Substantial transaction is emerging as an important test case for how the CMA approaches consolidation in the UK fibre market under the post-DMCCA regime. While the combined entity would remain smaller than Openreach at a national level, the granular overlap data suggests that the competitive effects of the merger may be concentrated within specific local markets where Virgin Media/nexfibre and Netomnia are already engaged in direct infrastructure competition.
The analysis highlights an important distinction between retail broadband choice and underlying network competition. Although many overlap areas appear highly competitive based on the number of consumer-facing broadband brands available, much of that retail competition is supported by the same underlying Openreach infrastructure.
At the same time, the data also reflects the broader structural challenges facing the UK fibre market. Many of the overlap areas are already highly saturated, with extensive infrastructure overbuild and limited remaining headroom for subscriber growth. Against that backdrop, the parties are likely to argue that consolidation may improve long-term network sustainability and strengthen competition against Openreach at a national scale.
Ultimately, the CMA’s assessment is likely to turn on whether fibre competition is viewed primarily through a national retail market lens or through a more granular local infrastructure framework. The regulator’s approach in this case may not only determine the outcome and timetable for the nexfibre/Substantial transaction, but also set an important precedent for how future Altnet consolidation is assessed across the UK broadband sector.
Would you like to gain valuable commercial insights to support your UK telecoms strategy in minutes, not weeks?
We conducted most of the above analysis by using Point Topic’s Query Agent, which has access to our postcode-level UK broadband data. You can try it free of charge here. The Local Authority Mapping Data is available to our subscribers, or see our Broadband Geography section for more information on how to access the service.

Comments