Broadband Graph
From data to intelligence with our semantic AI platform.
We have rolling research programmes generating unique, proprietary datasets that have been running for more than 25 years.
The Broadband Graph helps us bring meaning, intelligence and context to that data.
What is Broadband Graph?
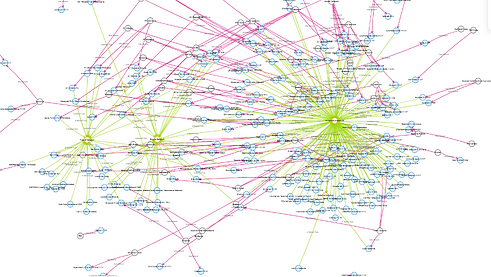
Broadband Graph is a semantic knowledge graph of the broadband market. We use our ontology, our model of the broadband world, to bring meaning and reason to our datasets
It connects networks, technologies, operators, tariffs, coverage, subscribers, regulation, geography, time and a range of demographic metrics into a single, accessible model.
A living representation of the broadband ecosystem.
What do you get?
We still sell data. But now with added intelligence, answers, insight, and context.
For a tour of the standard set of data, tools and intelligence available for each view you can watch one of the introductory videos below or download the product sheet with an outline. More details available on request but many of our tools have visitor modes so you can browse those as well!
Tools you can use or browse:
-
Common Telecoms Ontology - where relationships and meaning are added
-
Point Topic Query Agent - free credits to question our data and knowledge
-
Charting Engine - dynamic and informative and with some free maps and data
-
Network Valuation Tool - an early implementation and one of the favourites
Subscribers get premium access to all these and more.
What can you do with it?
You can use the outputs as you wish. The semantic layer isn't (strictly) even necessary if you just want a flat datafile.
Adding a knowledge graph however adds more meaning and is a richer output. Relationships and timelines are extra dimensions that often are made quickly accessible with a semantic layer in your data. It also prepares the data for access and interpretation by machine tools, like LLMs and agents.
You can ask real questions in natural language, analyse and compare markets, support regulatory assessment, investment due diligence, and competitive intelligence across local, national, and European markets.
Perhaps more importantly it means the data can be ingested and used directly, without additional reconciliation or restructuring. Direct access is provided via endpoints and MCP servers, enabling controlled queries and integration into existing data pipelines. Consistent definitions and pre-linked entities ensure stable, repeatable outputs over time, reducing engineering overhead and improving the reliability of downstream models, analytics and applications.
Why now?
For years, broadband data has existed in fragments: spreadsheets, PDFs, dashboards, maps, regulatory filings. Useful, but brittle. Two-dimensional. Hard to interrogate. Tagging data well and using a standard or common vocabulary has always been important but is even more vital today.
At the same time, statistical AI and large language models have effectively solved natural-language interaction. We can now ask questions of machines using platforms that open up new views.
The new dimension is meaning.
This is where Broadband Graph begins.
What's changed?
Statistical AI can talk, but it doesn’t understand.
Language models are powerful conversational interfaces, but on their own they hallucinate, lose context, cannot reliably reason across structured domains, and struggle with provenance, definitions, and consistency.
Semantic AI coupled with MCP servers (experts/context in a box) makes agentic RAG more reliable by grounding it in explicit structure: ontologies, knowledge graphs, and curated, expert-reviewed data.
Broadband Graph brings these together.
What makes it different?
We have been collecting, reviewing, and analysing broadband data since 1998: subscribers, tariffs, network deployments, operators, technologies, and regional metrics.
Every dataset has been reviewed by analysts, interpreted in context, and cross-checked against the market.
Broadband Graph makes data relatable, computable, and understandable, moving beyond flat tables and static charts.
Pricing and Services
£2500 per region (UK or Europe or RoW/global*) per seat per year - market data, analysis and access to some sub-national data
£5000 - corporate access
Sub national data
£5000 per seat per year - as above but with more detailed (high granularity/frequency) outputs for you to pick from. Multiple options available.
Ask us for a detailed quote
Postcodes, UPRNs and square kilometres
From £10k to £100k for our full intelligence service. Includes all the above.
Prices vary by fields, frequency and geography.
Ask us for a detailed quote.