Broadband Affordability in 2026: FTTP and FWA the most affordable but disparities persist
- Jolanta Stanke

- Feb 11
- 12 min read
Updated: Feb 13
Key findings:
As of January 2026, the lowest available broadband subscription at the ‘small area’ level varied from £12.50 (an FTTP tariff) to £35.28 (an FWA tariff). The downstream bandwidth varied from 11Mbps to 2,500Mbps.
Entry level tariffs in the under £20 range were available to just 21.9% of ‘small areas’. Twice as high a proportion of areas had entry level tariffs of £25 or higher, compared to May 2025.
The bandwidth on entry level tariffs also went up. The percentage of ‘small areas’ in the 100-200Mbps bandwidth range increased from 49.2 to 64.1%, while that in the 200-500Mbps range jumped from 4.4% to 18.1%.
FTTP has become even more dominant as the cheapest broadband technology, available in 69.3% of the UK postcodes, up from 43.2% in May 2025.
Rural LSOAs in England and Wales had on average 4.7 ISPs. The same figure for urban LSOAs was 6.3.
The average cheapest subscription in the postcodes with only one ISP was £30.07, compared to £24.62 in more competitive areas. The average downstream speeds were 67Mbps and 115Mbbps respectively.
Introduction and methodology
There are various definitions of broadband affordability. In the UK, Ofcom stated that ‘A good or service is considered to be affordable for a consumer if they are able to purchase it without suffering undue hardship’.[1] Ofcom’s Communications Affordability Tracker found that in October 2025, 7% of UK households cancelled a fixed broadband service because they could no longer afford it. In addition, 11% changed their fixed broadband package or tariff to make them more affordable[2].
We have developed our own UK broadband affordability tracker, which is based on residential fixed broadband tariffs marketed by retail ISPs. The aim is to identify the lowest available broadband subscription (‘entry level tariff’) that consumers can access in every postcode irrespective of broadband technology[3]. Our analysis also shows average entry level tariffs in every LSOA (England and Wales), Data Zone (Scotland) and Super Data Zone (Northern Ireland). (For brevity, we will refer to LSOAs, DZs and SDZs as ‘small areas’.) This is the sixth update in the series, with the data for this analysis collected in late January 2026.
Where more than one ISP offers the same monthly subscription in a postcode, we selected broadband tariffs with lower one-off charges and higher downstream speeds.
Many of these tariffs come with a minimum commitment of 12, 18 or 24 months. This reflects the reality that most households will sign up for a fixed term contract to get a better deal. One-off charges (for installation, activation and/or equipment) were not included in our calculations but they are contained in our dataset. Installation of broadband services tends to bear especially high cost in rural areas though some consumers can get the cost subsidised by the Government under the Gigabit Broadband Voucher Scheme.
Where special offers are available - for example, a number of months at a lower price or free of charge, we calculated the average monthly subscription, taking the offers and discounts into account. In this update, we also took into account the mid-contract price rises from ISPs who impose them. (Most altnets do not).
We did not include Social Tariffs as in most cases they are only available to selected groups of the population and are often not obvious on the ISPs’ websites (see our previous report).
We identified the lowest available broadband tariffs in an area based on the presence of ISPs in every UK postcode as of December 2025. In turn this was based on the ThinkPoint broadband availability dataset containing data from 1.7 million postcodes[4].
Note on regional variations: some ISPs vary broadband tariffs depending on the postcode. Where we discovered such variations, we used the most common pricing offered in various parts of the country.
[1] Affordability of Communications Services, Ofcom, July 2021.
[3] We excluded 5G/4G, satellite and (public) Wifi technologies.
[4] We acknowledge this is not a complete record, and some smaller ISPs may have been missed. Nevertheless, our analysis is based on 82 broadband providers, including all the largest ISPs, serving the majority of the UK broadband market.
Entry level broadband tariffs: a level playing field?
As of January 2026, the lowest available broadband subscription at the postcode level varied from £12.50 (an FTTP tariff) to £38.32 (a fixed-wireless access, or FWA tariff). The £12.50 tariff was advertised by Community Fibre as ‘Essential’ and came with 35Mbps symmetrical speeds on a 12 months contract. It was available in 51,979 postcodes, mainly in London.
At the other end of the spectrum, the cheapest broadband available in 37 postcodes was priced at £38.32 and supplied by Voneus. Its FWA package included average 40Mbps symmetrical speeds on a 24 months contract. The highest entry level tariffs available in a significant number of postcodes were from BT (£35.32 in 8,260 postcodes) and TalkTalk (£35.28 in 22,616 postcodes).
UK-wide detailed pricing data at the postcode and ISP level is available as part of our UK Broadband Mapping service, and it can be updated monthly upon request. Beyond this point, in this analysis we will mainly refer to the pricing at the small area level (LSOAs / Data Zones / Super Data Zones).
At the ‘small area’ level across the UK, entry level broadband subscriptions varied from £12.50 to £35.28 a month (Table 1). Compared to May 2025, the highest subscription has gone up from £29.95, as we are now taking into account mid-contract price rises.
Table 1. Lowest price broadband providers across LSOAs, DZs and SDZs (‘small areas’), January 2026. Source: Point Topic.
ISP | Technology | Monthly charge, GBP | One-off charge, GBP | Speed down, Mbps | Speed up, Mbps | Number of small areas | Price per Mbps (down) |
Community Fibre | FTTP | 12.50 | 0.00 | 35 | 35 | 4,173 | 0.36 |
Opus Broadband | FWA | 12.99 | 99.00 | 30 | 10 | 505 | 0.43 |
Kijoma* | FWA | 13.99 | 40 | 2 | 361 | 0.35 | |
Tove Valley | FTTP | 15.00 | 190.00 | 2,500 | 2,500 | 6 | 0.01 |
Grain Connect | FTTP | 15.66 | 0.00 | 250 | 250 | 764 | 0.06 |
Gigaclear | FTTP | 17.00 | 30.00 | 200 | 200 | 1,450 | 0.09 |
Zoom* | FWA | 17.00 | 70.00 | 15 | 1 | 44 | 1.13 |
Freedom Fibre | FTTP | 17.95 | 0.00 | 80 | 80 | 460 | 0.22 |
Quantum Fibre | FTTP | 19.00 | 0.00 | 120 | 120 | 1 | 0.16 |
Fibrus | FTTP | 19.16 | 0.00 | 159 | 34 | 606 | 0.12 |
VFast* | FWA | 19.50 | 199.00 | 24 | 1 | 679 | 0.81 |
toob | FTTP | 19.50 | 0.00 | 150 | 150 | 544 | 0.13 |
ClearFibre | FTTP | 20.00 | 0.00 | 250 | 250 | 19 | 0.08 |
PineMedia | FTTP | 22.00 | 0.00 | 100 | 100 | 54 | 0.22 |
4th Utility | FTTP | 22.50 | 0.00 | 50 | 50 | 338 | 0.45 |
Internetty | FTTP | 22.50 | 0.00 | 175 | 175 | 25 | 0.13 |
Full Fibre Ltd | FTTP | 23.00 | 160 | 80 | 726 | 0.14 | |
MS3 | FTTP | 23.00 | 0.00 | 160 | 80 | 254 | 0.14 |
Airband | FTTP | 23.00 | 0.00 | 150 | 150 | 398 | 0.15 |
ConnectFibre | FTTP | 23.50 | 0.00 | 250 | 250 | 175 | 0.09 |
Go Fibre | FTTP | 23.54 | 0.00 | 150 | 30 | 407 | 0.16 |
Voneus | FTTP | 23.62 | 0.00 | 250 | 250 | 159 | 0.09 |
CityFibre Sky | FTTP | 24.00 | 5.00 | 150 | 150 | 7,433 | 0.16 |
Zzoomm | FTTP | 24.00 | 0.00 | 200 | 200 | 280 | 0.12 |
Airband | FWA | 24.00 | 0.00 | 150 | 30 | 1,718 | 0.16 |
Northern Fibre Stix | FTTP | 24.00 | 50.00 | 80 | 30 | 2 | 0.30 |
Cambridge Fibre | FTTP | 24.00 | 125.00 | 100 | 10 | 2 | 0.24 |
Briant Broadband | FTTP | 24.00 | 150 | 150 | 6 | 0.16 | |
LightSpeed | FTTP | 24.69 | 9.99 | 150 | 150 | 372 | 0.16 |
Hyperoptic | FTTP | 24.74 | 0.00 | 158 | 155 | 1,444 | 0.16 |
Trooli | FTTP | 24.99 | 0.00 | 150 | 150 | 561 | 0.17 |
brsk | FTTP | 24.99 | 0.00 | 200 | 200 | 1,511 | 0.12 |
You Fibre | FTTP | 24.99 | 0.00 | 200 | 200 | 3,215 | 0.12 |
Quickline | FTTP | 24.99 | 0.00 | 200 | 200 | 329 | 0.12 |
RunFibre | FTTP | 24.99 | 0.00 | 200 | 200 | 5 | 0.12 |
FTTP | 24.99 | 0.00 | 100 | 18 | 19 | 0.25 | |
GNetwork | FTTP | 25.00 | 29.00 | 300 | 100 | 15 | 0.08 |
WeFibre | FTTP | 25.00 | 0.00 | 1,000 | 1,000 | 20 | 0.03 |
TrueSpeed | FTTP | 25.00 | 150 | 150 | 218 | 0.17 | |
BrightonFibre | FTTP | 25.00 | 0.00 | 150 | 150 | 11 | 0.17 |
Wessex Internet* | FWA | 25.00 | 148.00 | 30 | 5 | 40 | 0.83 |
Wildanet | FTTP | 25.46 | 100 | 20 | 125 | 0.25 | |
FW Networks | FTTP | 25.67 | 0.00 | 150 | 150 | 388 | 0.17 |
Wight Fibre | FTTP | 25.95 | 0.00 | 150 | 150 | 89 | 0.17 |
Exascale | FTTP | 25.99 | 0.00 | 50 | 50 | 1 | 0.52 |
Sky** | FTTP | 26.00 | 5.00 | 100 | 20 | 12,478 | 0.26 |
Lightning Fibre | FTTP | 26.00 | 0.00 | 150 | 150 | 22 | 0.17 |
CityFibre Vodafone | FTTP | 26.67 | 0.00 | 82 | 82 | 2 | 0.33 |
Sky** | FTTC | 27.00 | 5.00 | 67 | 17 | 773 | 0.40 |
Green Co | FTTP | 27.00 | 0.00 | 500 | 2 | 0.05 | |
Alncom | FTTP | 27.00 | 0.00 | 200 | 2 | 0.14 | |
OFNL | FTTP | 28.15 | 30.00 | 40 | 10 | 3 | 0.70 |
TalkTalk | FTTP | 28.44 | 0.00 | 150 | 30 | 92 | 0.19 |
Wessex Internet* | FTTP | 29.00 | 49.00 | 100 | 15 | 4 | 0.29 |
Ogi | FTTP | 29.00 | 0.00 | 250 | 25 | 1 | 0.12 |
Virgin Media O2 | DOCSIS3.1 | 29.32 | 0.00 | 264 | 25 | 44 | 0.11 |
Virgin Media O2 | FTTP | 29.32 | 0.00 | 264 | 25 | 18 | 0.11 |
nexfibre Virgin Media | FTTP | 29.32 | 0.00 | 264 | 25 | 0.11 | |
KCOM | FTTP | 29.82 | 24.99 | 100 | 100 | 45 | 0.30 |
BT | FTTP | 30.32 | 0.00 | 36 | 10 | 332 | 0.84 |
BT | FTTC | 30.32 | 0.00 | 34 | 7 | 134 | 0.89 |
TalkTalk | ADSL | 35.28 | 0.00 | 11 | 1 | 1 | 3.21 |
* Data cap applies
** Mid-contract price rises were not disclosed at the time of data collection, although the tariffs were advertised with a note ‘prices may change during the contract’.
Similarly to the postcode level, the cheapest option was the £12.50 ‘Essential’ broadband package from Community Fibre, available in 4,173 areas. At the other end of the scale, in one ‘small area’ the cheapest broadband available was supplied by TalkTalk at £35.28 a month. It was an ADSL service with a free activation and 24-month commitment. BT’s FTTC/FTTP tariffs were the next most expensive entry level plans at £30.32 with download speeds of 34-36Mbps.
In terms of downstream bandwidth and price ratio, TalkTalk’s ADSL service also came out as the most expensive at £3.21 per Mbps, with BT also at the bottom of the ranking with £0.89. In comparison, the cheapest costs per Mbps at £0.01-£0.03 were from the likes of Tove Valley and WeFibre, the FTTP altnets offering symmetric 2.5Gbps and 1Gbps speeds. In the case of Sky, whose entry level 100/20Mbps broadband plan came out as the cheapest in the largest number of ‘small areas’ (12,299), the average cost per Mbps was £0.26.
Compared to May 2025, we saw the cheapest broadband tariffs becoming available in slightly fewer ‘small areas’. In January 2026, the entry level tariffs at the lower end of the price range (£10 - £14.99) were available in 11.5% of ‘small areas’, as opposed to 13.1% we recorded in May 2025. However, entry level tariffs in the under £20 range were available in 21.9% of ‘small areas’, compared to 19.1% of areas in May 2025, so there was a small improvement.
Twice as high a proportion of ‘small areas’ had higher entry level tariffs, compared to May 2025. They varied between £25.00 and £29.99 in 32.8% of ‘small areas’ in January 2026, compared to 15% in May 2025. The largest proportion of ‘small areas’ (44.3%) had entry level tariffs ranging from £20.00 to £24.99 (this figure was 65.9% in May 2025). The fact that we are now taking into account mid-contract price rises did have some effect on price distribution in our January 2026 data, although we recorded price increases for many ISPs, including the altnets that offer prices fixed for the duration of the contract. Understandably, inflation and increased costs played a part.

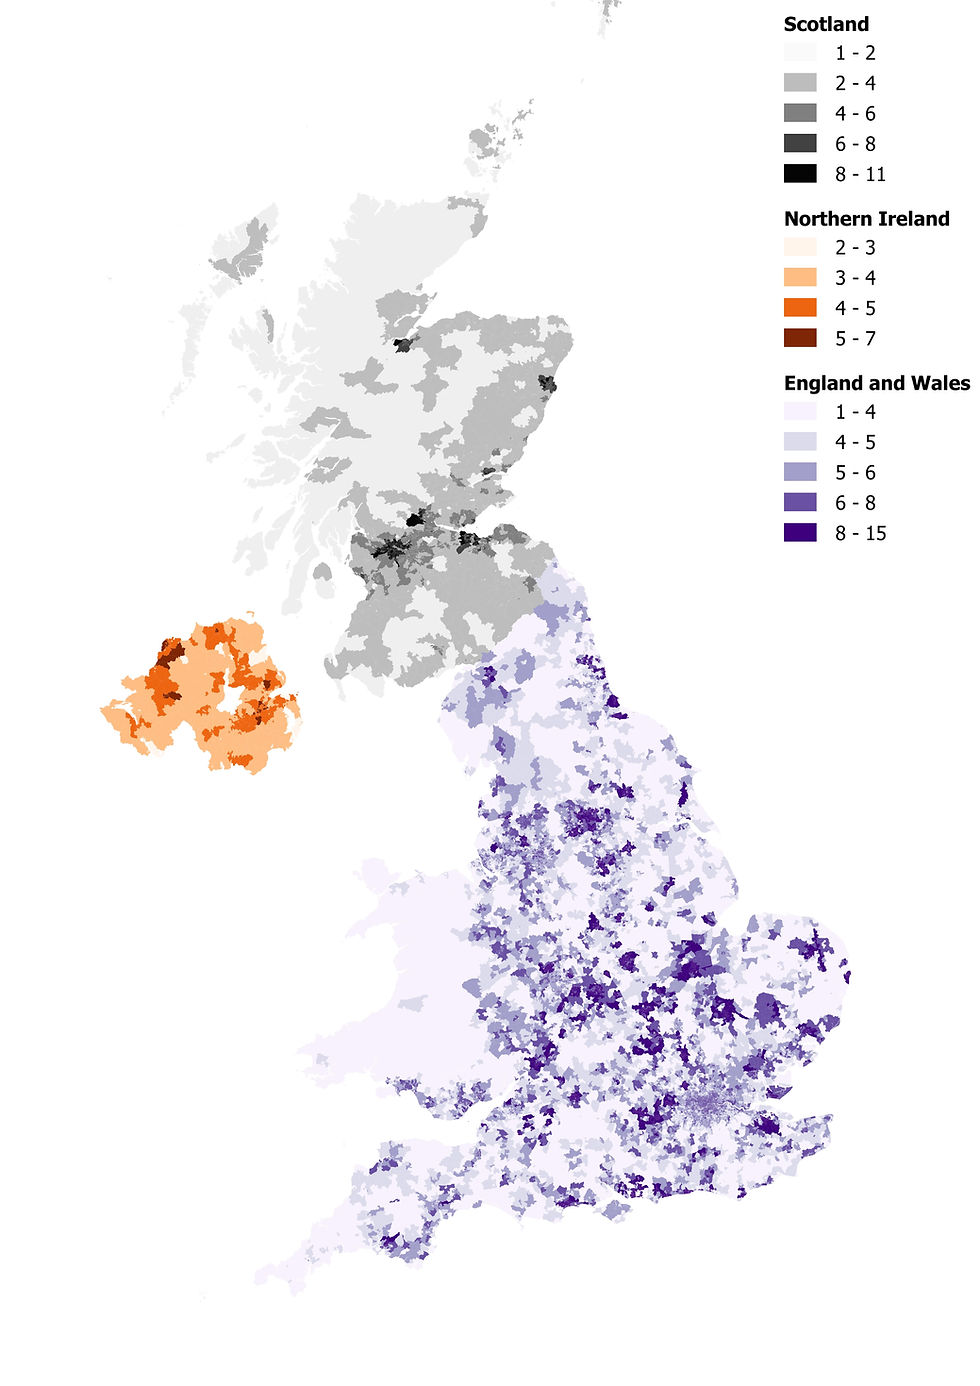
The geographical distribution of the monthly pricing can be seen in the map below. In England, the lowest entry level broadband tariffs tended to be available in large swathes of mainly rural areas, where FTTP altnets and some FWA providers have significant footprints, as well as in London, where Community Fibre offered its £12.50 plan. A number of altnets offered £20-24 plans in many small areas in South Wales, the Southwest, the Midlands, and the Northeast. The tariffs at the higher end of the spectrum dominated a lot of the rest of England and Wales as well as urban areas in Northern Ireland and many ‘small areas’ of Scotland.

FTTP has become even more dominant as the cheapest broadband technology (available in 69.3% of the UK postcodes, up from 43.2% in May 2025), as Openreach, Virgin Media O2 and altnets continue with fibre rollout (Table 2). However, the proportion of postcodes where the cheapest broadband plans available are on Docsis 3.1 has dropped significantly (1.46% compared to 28.4% in May 2025), not least because we are now taking into account mid-contract price rises from the likes of VMO2 (most altnets do not increase their prices mid-contract). Table 2. Distribution of technologies and pricing offered on cheapest broadband subscriptions, January 2026. Source: Point Topic.

FWA-based cheapest broadband tariffs are available in slightly more postcodes (6.3% compared to 4.3% last year). It remains common in the Southeast, parts of the Southwest, Wales and the Midlands (Figure 3).

Along with its broad availability, on average FTTP continued to be among the cheapest entry level options for consumers (£24.35), second only to FWA (£19.95). Having said that, most of the FWA plans come with a hefty one-off charge and data usage caps. Docsis 3.1 based entry level broadband plans were the second most expensive (£29.32). ADSL is on the way out, and it is on average the most expensive, compared to the other technologies (£35.29) (Table 2).
Entry level tariffs came with a range of downstream bandwidth – the geographical distribution is visible in the map below. Compared to May 2025, we saw more areas with higher entry level speeds across all four nations of the UK, as this time we identified many more areas with FTTP as cheapest broadband technology.

In terms of numbers, compared to May 2025, the percentage of ‘small areas’ in the 100-199Mbps bandwidth range increased from 49.2 to 63.8%, while that in the 200-499Mbps range jumped from 4.4% to 18.2% (Figure 5). The downstream speeds in the under 100Mbps range (more typical of FTTC and FWA) were available in 17.9% of ‘small areas’, compared to 45.9% in May 2025. In 28 ‘small areas’, the cheapest entry level broadband plans offered 500Mbps+ download speeds, down from 213 areas in the previous research period.

The level of competition at the small area level varies significantly across the UK. The largest number of ‘small areas’ (23.5%) had five ISPs, and 21.9% had six.

The general trend is that consumers in urban areas with high population density are still enjoying higher availability of competing ISPs[1] [2]. A lot of consumers in Wales, parts of the Southwest, East Anglia and the Highlands have fewer providers to choose from (Figure 7). Rural LSOAs in England and Wales, for example, had on average 4.7 ISPs. The same figure for urban LSOAs was 6.3.
[1] The map shows retail ISPs. For example, CityFibre resellers are regarded as separate ISPs.
[2] The map reflects the largest 82 ISPs included in this study.
Does competitive landscape affect the average price and bandwidth of broadband services available in the area? We compared postcodes with one ISP and those with more than one broadband provider. UK-wide, we found 128,905 postcodes (7.5%) with only one broadband provider, down slightly from 131,420. BT and Virgin Media O2 are dominating these postcodes, with 75% and 11% of postcodes respectively.
There appear to be significant differences in the average and median subscriptions, with more competitive postcodes enjoying lower entry level broadband tariffs (Table 3). For example, the average cheapest subscription in the postcodes with only one ISP was £30.07, compared to £24.62 in more competitive areas. The median values were £30.32 and £26.00 respectively. The differences in the average and median downstream speeds were even more striking: the average speed in postcodes served by 1 ISP was 67Mbps compared to 115Mbps in postcodes with more than one ISP. The median speeds were 36Mbps and 100Mbps respectively.
Table 3. Lowest broadband tariffs (GBP) and bandwidth in postcodes with different competition levels, January 2026. Source: Point Topic.

Areas with no competition are often in remote and rural areas – we found 1 ISP in 53 rural LSOAs and 12 urban LSOAs, so we used another test to compare the available entry level broadband tariffs. The average entry level subscription was slightly higher in rural areas - £23.30 as opposed to £22.19 in urban areas. The same was true for the median subscription – it was £24.99 in rural and £24.00 in urban areas (England and Wales) (Figure 8).

The difference in downstream bandwidth was more pronounced. Interestingly, the average downstream bandwidth in rural areas was 144Mbps compared to 125Mbps in urban ones. This was the case because a higher proportion of rural ‘small areas’ was in the 200-499Mbps speed range (28.7% compared to 18.6% of urban LSOAs), mainly served by altnets. There was no difference in median speeds – they were 150Mbps in both types of areas (Figure 9).

Conclusion
The price and bandwidth of the entry level broadband plans that consumers can access in different areas of the UK continue to be variable. In January 2026, the lowest available broadband subscription at the postcode level ranged from £12.50 to £38.32. Entry level tariffs in the under £20 range were available to just 21.9% of ‘small areas’.
The downstream bandwidth varied from 11Mbps to 2,500Mbps. Compared to our previous update in 2025, high bandwidth on entry level tariffs (100Mbps+) was available in more areas but the same was true for monthly subscription, which was more expensive in more areas.
‘Digital deprivation’ is still present in some parts of the country. Consumers in areas with no competition from multiple ISPs and in rural areas are disadvantaged in terms of the entry level broadband pricing. The pricing differences are especially notable between ‘no competition’ (1 available ISP) and more competitive postcodes, with the latter also having significantly higher bandwidth.
When it comes to broadband speeds, residents of rural areas are getting higher average bandwidth. This is because the majority of rural areas are served by alternative operators who tend to offer higher speeds.
So, the lack of competition appears to be an important factor impacting broadband pricing and bandwidth on offer, with the lower population density in rural areas also having an effect on pricing.
At the same time, the cost of living crisis continues, making consumers to rethink their spending priorities. With 7% of UK households cancelling a fixed broadband service due to cost and 11% changing their plan to make it more affordable[1], broadband is indeed becoming a luxury in some homes.
Get in touch
The complete dataset used to produce this analysis is part of our UK Broadband Mapping at postcode level and UK Plus services. For more information see https://www.point-topic.com/uk-mapping and https://www.point-topic.com/ukplus
To find out more you can contact us on 020 3301 3303 or e-mail oliver.johnson@point-topic.com


Comments