Broadband affordability in the UK in January 2024: A Postcode Lottery
- Jolanta Stanke
- Jan 25, 2024
- 9 min read
Introduction
There are various definitions of broadband affordability. In the UK, Ofcom stated that ‘A good or service is considered to be affordable for a consumer if they are able to purchase it without suffering undue hardship’.[1]
According to Ofcom, between July 2022 to January 2023, its Communications Affordability Tracker found that ‘around three in ten households had difficulty affording their communications services in the last month’ (Affordability of Communications Services, April 2023 Update by Ofcom).
Another way of assessing broadband affordability is looking at how the price of broadband varies across the country and how it relates to digital deprivation. To this end, we compared the rankings of small UK areas by entry level broadband subscriptions and by BDDI (Broadband Digital Deprivation Index), first developed by Point Topic in 2013.
Methodology
For this analysis, we used residential broadband tariffs marketed by retail ISPs in January 2024. Broadband services with the lowest available monthly subscriptions that consumers can access in every postcode, and in turn in every LSOA (England and Wales), Data Zone (Scotland) and Super Data Zone (Northern Ireland), irrespective of broadband technology, were the basis of our comparison[2]. (For brevity, we will often refer to LSOAs, DZs and SDZs as ‘small areas’.) Where more than one ISP offered the same monthly subscription, we took into account one-off charges, downstream and upstream speeds. (We selected broadband tariffs with lower one-off charges and higher speeds).
Many of these tariffs came with a minimum commitment of 12, 18 or 24 months. This reflects the reality that most households will sign up for a fixed term contract to get a better deal. One-off charges (for installation, activation and/or equipment) were not included in our calculations but we quote them for illustrative purposes, as they can add to the cost of broadband. Installation of broadband services tends to bear especially high cost in rural areas though some consumers can get the cost subsidised by the Government under the Gigabit Broadband Voucher Scheme.
Where special offers were available (for example, a number of months at a lower price or free of charge), we calculated the average monthly subscription, taking the offers and discounts into account. We did not take into account the mid-contract price rises, however, though not all ISPs will be imposing them. This is something to look into when we do our next update.
We identified the lowest available broadband tariffs in an area based on the presence of particular ISPs in every UK postcode as of December 2023. In turn this was based on the ThinkPoint broadband availability dataset containing data from 1.7 million postcodes[3].
We excluded social tariffs as they are available to limited groups of population, and their take-up is quite low in any case. In 2023, 220,000 households were on social tariffs, with only 5.1% of Universal Credit claimants being on a social tariff. As of February 2023, 51% of benefit claimants were not aware of social tariffs (Affordability of Communications Services, April 2023 Update by Ofcom).
Entry level cost of broadband and what consumers get for it
As of January 2024, the lowest available monthly broadband subscription at the postcode level varied from £13.99 (a fixed-wireless (FWA) service) to £41.25 (an FTTP service). The £13.99 monthly subscription was advertised by Kijoma, although we were not able to establish whether the ISP is still taking new customers. This price was marketed for a FWA service with 40/2 Mbps (down/up) speeds and 20GB monthly data cap. Vispa’s FTTP package priced at £41.25 included 100M/20 Mbps speeds and no usage limits.
Below is an example of monthly subscription distribution at the postcode level in and around Cardiff. In this area, the cheapest broadband available to consumers in one lucky postcode was a 4th Utility FTTP plan priced at £15.00 a month and offering 50/50Mbps speeds. In the majority of postcodes (38%), however, the cheapest broadband was offered by TalkTalk – it was an FTTC plan with 38/9Mbps speeds at an average price of £25.38 a month (£14.50 a month for six months, then £29.00 a month for 18 months with a 24 month contract).

UK-wide detailed pricing data at the postcode level is available to our customers, and it can be updated monthly upon request. In this analysis we are focusing on the pricing at the small area level (LSOAs / DZs / SDZs).
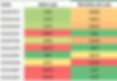
At the small area level across the UK, entry level broadband subscriptions varied from £13.99 to £29.99 a month (Table 1). As at the postcode level, the cheapest option was a £13.99 FWA plan advertised by Kijoma. Another FWA provider VFast followed with a £14.50 plan offering 24/1Mbps speeds and 5GB usage cap. It came with a hefty one-off charge of £199.00. At the other end of the spectrum, in some areas the cheapest broadband was supplied by BT at £29.99 a month. It was and ADSL service with a £31.99 activation charge, and it came out as the cheapest option in 4 small areas.
The cheapest broadband based on the FTTP technology was available in 428 small areas from 4th Utility. With 50/50 Mbps speeds and a £15 monthly subscription it came third in lowest price table, offering the best value for money in terms of bandwidth and price ratio.
Table 1. Lowest price broadband providers across the small areas of the UK (January 2024)


* Data cap applies
UK-wide, in the majority of small areas (58%), the cheapest monthly subscription was in the £20.00-£24.99 range. It varied between £25.00 and £30.00 in another 27% of small areas.

The geographical distribution of the monthly pricing can be seen in the map below. In the maps in this analysis we are using the 2021 codes and boundaries for LSOAs in England and Wales and for Super Data Zones in Northern Ireland, and the 2011 boundaries and codes for Scotland’s Data Zones. (Scotland did not update the codes and boundaries of their small areas at the time of writing).

FTTC is dominating as the entry level technology (51% of all small areas), but we can also see a significant number of areas with FTTP offering cheapest broadband (40%), as an increasing number of FTTP providers compete for the same customers. FWA dominates more remote and rural areas in the Southwest, Southeast, and Northeast.

In fact, in the areas where the cheapest broadband available was FTTC-based monthly subscriptions were often higher than in the ‘FTTP areas’ (Table 1). As a result, FTTP entry level tariffs were on average cheaper compared to FTTC (Table 2). Docsis3.1 based entry level broadband plans were most expensive, while FWA-based were cheapest, on average. Having said that, speeds on FWA plans tend to be lower and they sometimes include usage caps.
Table 2. Distribution of small areas by broadband technology offered on cheapest entry level subscription

Note: presence of other technologies (ADSL and Gfast is not significant).
Entry level tariffs come with a range of downstream bandwidth – the geographical distribution is visible in the map below.

In most small areas (74.7%), the download speeds available were in the under 100Mbps range (typical of FTTC and FWA). However, in 25.4% of small areas, FTTP or Docsis3.1 speeds of 100Mbps+ were offered on the entry level plans. In two small areas, the cheapest broadband plan came with symmetric 900Mbps speeds. Priced at £25 a month, it was offered by toob. (The percentage was too small to show in the chart below).

The level of competition at the small area level varies significantly across the UK, as shown in the map below. Predictably, the general trend is that consumers in large urban areas with high population density are still enjoying much higher availability of competing ISPs[4] [5].

However, the correlation between the lowest monthly subscription available and the level of competition (number of ISPs selling the service) is weak. It is -0.143 at the postcode level and -0.109 the small area level (January 2024).
Broadband pricing and BDDI
More broadly, we thought it would be interesting to compare the area rankings by entry level monthly subscription with the rankings by BDDI (Broadband Digital Deprivation Index), developed by Point Topic. Our recent report describes it in more detail but we will provide a compact definition here.
The components of the Broadband Digital Deprivation Index (BDDI) are:
· Age
· Education
· Disability
· Presence of children
· Tenure (social housing)
· Income
· Broadband infrastructure index (BII)
In turn, the components of the Broadband Infrastructure Index (BII) are:
· FTTP Availability
· FTTC Availability
· DSL Availability
· Cable Availability
· Operator Count
· Download Speed
· Upload Speed
The lower the BDDI, the less digitally deprived the area is in terms of broadband.
To produce such a comparison, we first ranked all LSOAs, SDZs and DZs in each of the four UK nations by the average entry level monthly subscription (the lower the rank the lower the entry level subscription). We used separate rankings for England, Wales, Scotland and Northern Ireland because our BDDI is also split by nations due to methodological differences between them (see the BDDI report for details). We found the correlation between the BDDI rankings and monthly subscription rankings to be positive but very weak in three out of the four nations (0.16 for England, 0.008 for Wales, 0.18 for Scotland). In Northern Ireland, it was negative but still very weak (-0.09). This suggests that the ISPs do not necessarily set their pricing depending on the deprivation and competition level in a particular area.
In some small areas, for example, BDDI rank matches closely the entry level monthly subscription rank, i.e. some small areas can be highly digitally deprived and have high broadband prices, and vice versa.

In terms of market forces, the above example does make sense as more deprived areas are less attractive, which results in fewer providers in an area and hence low competitive pressure to offer competitive prices. The demand for broadband in such areas can also be lower.
On the other hand, there are highly digitally deprived areas, where entry level broadband subscriptions are among the lowest in the country, and vice versa. Further research would be needed to determine, whether this is by design (broadband providers know how much they can reasonably charge) or by accident.
The above tables are just small snapshots. A broader trend can be seen in the four nation maps featured below. As we pointed out, the correlation between rankings of digital deprivation and broadband pricing appears to be weak.
 |  |
Figure 8a. Distribution of Scotland Data Zones by BDDI rank, 2021 | Figure 8b. Distribution of Scotland Data Zones by average entry level monthly subscription, January 2024 |
For example, in Scotland one can see that most small areas (Data Zones) rank rather high by the entry level subscription but they are spread across a whole spectrum of BDDI rankings. Lower subscriptions are most prominent in the urban areas of Edinburgh, Glasgow, Dundee, Aberdeen, Inverness and around them, and the level of competition (the number of ISPs) appears to be an important factor in bringing the prices down[6]. A related element, of course, is the terrain, with the Highlands and Islands being a less inviting domain for multiple broadband providers to build their networks. Similar trends can be seen in Wales, with the urban locales outside mountainous areas more likely to benefit from lower broadband prices.
In addition, the cost of providing services in certain areas, especially rural or remote locations, can be higher due to the need for additional infrastructure. This is often reflected in high installation charges of FWA broadband access and rural FTTP networks.
 |  |
Figure 9a. Distribution of Wales LSOAs by BDDI rank, 2021 | Figure 9b. Distribution of Wales LSOAs by average entry level monthly subscription, January 2024 |
In England, cheaper broadband is more common across large swathes of the southern half of the country. One exception is the Northeast, where competition from FWA providers led to the lower average subscription. The less digitally deprived LSOAs (with the lowest BDDI rank) are well spread across the South but they are also more common in the Northwest and Northeast, for example, than the LSOAs with lower priced broadband. Again, the rurality, competition and demand come into play.
 |  |
Figure 10a. Distribution of England LSOAs by BDDI rank, 2021 | Figure 10b. Distribution of England LSOAs by average entry level monthly subscription, January 2024 |
In Northern Ireland, the picture is similar to the other three nations, although one can see more digitally deprived areas with lower pricing.
 |  |
Figure 11a. Distribution of Northern Ireland SDZs by BDDI rank, 2021 | Figure 11b. Distribution of Northern Ireland SDZs by average entry level monthly subscription, January 2024 |
Finally, a lower monthly subscription could be caused by a temporary promotion, an ISP’s strategy to lock in as many customers as possible, and the availability of investment to fund initial discounts before the need to generate sufficient returns to cover the cost of deployment kicks in.
Conclusion
The quality of the entry level broadband plans that consumers can access in different areas of the UK is variable. Depending on where they live, the cheapest broadband available to households in some areas is an FTTP-based service with 50/50Mps speeds for £15 a month, or an FTTC connection with 35/8Mbps speeds for £26.99 a month.
In addition, due to deprivation, households in some areas will spend a larger proportion of their income on basic broadband than in others and / or they will have a lesser choice of service providers due to limited competition.
When left to market forces alone, digital inequality will become inevitable, as broadband pricing can be affected by the level of demand and competition, the attractiveness of the area and the cost of network deployment, the specific stages in the revenue cycle of broadband providers , and sometimes their lack of understanding of their target market, making it a postcode lottery for households seeking affordable ‘decent’ broadband.
Meanwhile the importance of affordable broadband access has become highlighted by the Covid-19 pandemic, and it will become more and more of a necessity in many areas of daily life, from flexible working, finding employment, education to healthcare. At the same time, rising energy, food, and other prices continue to exacerbate the cost of living, making consumers think twice about their spending priorities. With 11% of households cancelling a communications service in January 2023[7], broadband is at risk of becoming an unaffordable ‘luxury’ in some homes.
Get in touch
The complete dataset used to produce this analysis is part of our UK Broadband Mapping at postcode level and UK Plus services. For more information see http://point-topic.com/our-services/thinkpoint/ and https://www.point-topic.com/ukplus
To find out more you can contact us on 020 3301 3303 or e-mail isabelle.anderson@point-topic.com
[1] Affordability of Communications Services, Ofcom, July 2021.
[2] We excluded mobile, satellite and (public) Wifi technologies.
[3] We acknowledge this is not a complete record, and some smaller ISPs may have been missed. Nevertheless, our analysis is based on over 90 broadband providers, which is a significant proportion of the UK ISPs.
[4] The map shows retail ISPs.
[5] Our data and the map reflects the largest 95 ISPs we track.
[6] This includes competition between ISPs reselling services over the same networks (e.g. CityFibre, MS3 etc), between altnets and competition with Openreach, especially in the context of Equinox 2.
[7] Affordability of Communications Services, April 2023 Update by Ofcom.