FTTP broadband adoption rates and market value in Europe: latest update
- Jolanta Stanke

- Mar 1, 2024
- 9 min read
Updated: Mar 4, 2024
Full fibre (FTTP/H/B) rollout continues across Europe, with an increasing percentage of households being able to access fibre broadband[1]. After the investment and planning efforts have been spent on putting fibre in the ground (or in the area), the operators are facing a rather more difficult challenge of persuading consumers to take up the service.
In this analysis, we are looking at the extent fibre adoption rates differ across European countries, and the broader context of these metrics. We also developed a model to assess current and potential FTTP broadband subscription revenues that can be generated in a country – the so called revenue headroom – depending on fibre adoption rates.
In this instance we are focusing on residential broadband services. The model can be extended to the global scale as well as adapted to other technologies and services (for example, business broadband, pay TV) and different time scales.
This research combines data from two of our services - Global Broadband Statistics and European Broadband Operators and Tariffs - as well as other inputs such as the Broadband Coverage in Europe[2] studies which Point Topic co-authored for the European Commission. All the data quoted in this analysis refers to mid-2022.
Fibre adoption rates: a mixed picture across Europe
First we looked at to what extent fibre adoption rates vary between countries. By fibre adoption rate we mean the number of fibre broadband subscribers divided by the number of homes passed covered by fibre networks in a country. As of mid-2022, fibre adoption rate ranged from 10.9% in Austria and Greece to 93% in Iceland, with the average among the 30 European countries standing at 54.4%, up from 53.3% in mid-2021.

Between 2021 and 2022, we saw the largest positive change in the FTTP adoption rate in Sweden, where it went up from 77.3% to 90.3% (+13%). While enjoying healthy competition in the market, the country saw a 6% increase in fibre broadband subscribers. In nominal terms, the number of FTTP homes passed actually went down by 9.2% due to the drop in the total household number but the percentage of households with FTTP access in Sweden increased by 2% to 84.5%.

At the other end of the spectrum, fibre adoption rate fell from 97.5% to 83.3% in Finland (-14.2%). In this country, the number of FTTP homes passed grew by 26% while the number of fibre broadband subscribers increased by only 7.6%. Nevertheless, fibre adoption in Finland is still much higher than the EU average.

Between June 2021 and June 2022 we recorded the highest growth in FTTP subscribers in Greece (+171.4%), where this broadband technology was introduced relatively recently, so the growth came from a very low base. In the same period, the country saw a 40% increase in FTTP homes passed to more than 1m. Given the low subscriber base figure though the country was at the bottom of fibre adoption table along with Austria.
The UK and Belgium were the other two countries with high growth in FTTP subscribers – their numbers more than doubled (+85.1% in the UK and +67.6% in Belgium). Like Greece, Belgium was rather slow in introducing full fibre, although the rollout pace has been picking up – homes passed were up by 71.3% and fibre subscribers by 67.6% in 2021-2022, resulting in a 23.3% fibre adoption rate.
FTTP deployment in the UK is in full swing, with the incumbent operator and altnets building fibre networks (homes passed shot up by +58.9% in 2021-2022), though this process has slowed down lately due to the economic headwinds. Between 2021 and 2022, the FTTP subscribers increased even faster (+85.1%), though at the end of the period fibre adoption rate in the UK was only 34.7%, so the country’s operators still have a lot of catching up to do in attracting consumers to fibre broadband products, as do the Belgian ISPs.
Comparing fibre adoption in two countries: an example
Our model enables users to compare fibre adoption trends over time across different countries. Let’s take Germany and France as an example. In France, fibre adoption rate is more than twice as high compared to Germany.

To some extent this can be explained by well-established VDSL and Docsis 3.0/3.1 (superfast and ultrafast)[3] networks in Germany, with 94.8% and 62.8% of households still covered by them respectively in mid-2022. In France, these figures were 15.9% and 20.2%. Between 2013 and 2022, VDSL and Docsis 3.0/3.1 coverage in Germany has been growing steadily (Docsis coverage fell for the first time only in 2022). Over the same period, France saw VDSL and especially Docsis coverage drop, while multiple operators in the country pushed ahead with FTTP rollouts. Meanwhile German operators, especially Deutsche Telekom, favoured VDSL until relatively recently.

Although in both countries FTTP coverage increased between 2013 and 2022, the curve is much steeper in France, with this metric increasing from 10.5% in 2013 to 73.3% in 2022. Germany started with a lower base of 4.4% of households covered by fibre networks in 2013, and saw a much slower growth in FTTP household coverage, reaching 19.3% in 2022.

We can infer that the relatively low fibre adoption rate in Germany, at least in comparison to France, is related to lower availability of full fibre networks in the country. That latter impacted consumer awareness of their advantages, as well as resulted in a low number of peers who adopted fibre services and whom other consumers may want to imitate. At the same time, high availability of VDSL and Docsis networks means high numbers of subscribers to these platforms who are happy with the speeds they are getting and are less likely to switch to FTTP, which is often more expensive.
What impacts fibre adoption among consumers?
We looked at various factors that may influence fibre adoption rates and found strong to moderate negative correlation with xDSL market share (xDSL share of all fixed broadband subscribers) in all but seven countries. One could argue this suggests that consumers tend to migrate from xDSL to full fibre networks, not least because it’s primarily xDSL network operators who upgrade their infrastructure to FTTP. We must be cautious, however, about drawing firm conclusions about this and other correlations we discovered due to the small sample size of the measurements (ten data points (time periods) per country, between 2013 and 2022).

Some recent studies looking at barriers for consumer migration to FTTP networks[4] discuss a number of other factors slowing down migration from copper to full fibre:
the FTTP upgrade process which requires an engineer visit and installation work at the property;
the tendency of consumers to stay with status quo;
the fact that VDSL consumers were often already told by ISPs they were getting ‘fibre’;
the lack of perceived reward (VDSL is ‘good enough’);
low demand from small households with few devices, renters who may need landlord’s permission and time poor people.
Some of the above barriers are related to the lack of consumer understanding of, and probably caring about, the features and technology of the broadband services they are using. Our recent survey of UK consumers showed that between 16% and 30% per cent of the respondents, depending on the ISP, were unaware of their broadband speed tier. [5] Between 7% and 39% of the respondents did not know whether their broadband service was provided over full fibre.
Another factor to consider is that the migration potential from copper to fibre varies significantly across markets. By migration potential we mean broadband households using DSL (ADSL or VDSL) services. In theory, they could all be upgraded to FTTP as long as there are enough FTTP lines available in the areas where they live. This will of course depend on the number of homes passed by FTTP networks as things stand. In the markets where FTTP networks are not large enough to accommodate all existing DSL subscribers, the higher the migration potential the higher the rationale, one could argue, to extend fibre infrastructure further, while also taking into account the migration barriers outlined above.
In 14 of the 30 European countries covered in this analysis, there are more subscribers still using DSL broadband than FTTP lines available (‘FTTP headroom’ is the number of homes passed by FTTP minus current FTTP subscribers). In Switzerland, Greece, Iceland and Belgium the ratio of xDSL subscribers to FTTP lines available is more than 3 to 1. In Germany it is 5 to 1. In all these markets, the incumbents have been focusing on VDSL for a long time, with the number of available FTTP lines way below the number of households still on DSL broadband. On the other hand, xDSL subscribers constitute only 11% of the FTTP headroom, so the majority of FTTP lines will have to be sold to households using other technologies or those still without broadband.

The migration potential from copper to fibre across Europe will change as FTTP networks are extended to pass more premises. Of course, migration from copper to fibre is not always possible as some FTTP providers (especially altnets) are rolling out their networks outside the areas where DSL subscribers are located, for example for new built homes or in wealthier rural areas, although this will cover a small proportion of households. At the same time, some xDSL providers are slow to roll out FTTP networks, still sticking with VDSL. Some of the migration though will come from Docsis networks as providers upgrade that technology to FTTP. Virgin Media O2 in the UK is one example.
We looked at possible correlation between fibre adoption and a number of other factors – Docsis and VDSL coverage, Docsis market share of all subscriptions, VDSL household penetration, and fibre broadband pricing, but we could not detect definite Europe-wide trends. Some of these factors appear to be correlated with fibre adoption in some markets, but given the small number of data points we will refrain from making generalisations.
Fibre broadband revenue: current and potential
Whatever the reason for the lack of fibre adoption in some markets, the data on adoption rates can be used to estimate and benchmark current and potential additional revenue (headroom) from fibre broadband services.
Our FTTP revenue model described below is using a hypothetical split of fibre broadband subscribers by tiers of tariffs they subscribe to (monthly subscriptions). The calculations are based on Point Topic’s tariff and subscriber data as of mid-2022. All tariffs used in this model are at USD$ PPP rates. The maximum available revenue is based on 100% of FTTP homes passed subscribing to an FTTP service.
In this first example we set the tariff tier split as follows:

We assume that 10% of residential broadband subscribers take the most expensive FTTP services, with 20% taking the mid-price ones and 70% going for the lowest monthly subscriptions. (The tariff tier splits will vary between different countries and operators, and the model gives users the flexibility to adjust the tier splits depending on each particular case.)
In this example we compare the two selected countries – Germany and France.

With the tariff tiers set as above, French operators would have been generating six times more revenue from residential FTTP broadband services at almost $941m (PPP) compared to $150m (PPP) in Germany. This is the case because in 2022 France had a much higher number of FTTP subscribers, and the average FTTP ARPU in this country was $57.70 PPP, compared to $49.98 PPP in Germany.
On the other hand, the potential additional revenue that could be generated from such services if 100% fibre adoption were achieved is only slightly higher in France - $289m (PPP) compared to $249m (PPP) in Germany. This is because FTTP headroom in terms of the number of available fibre lines in Germany was very similar to that in France – despite its lower FTTP adoption rate, Germany had much fewer homes passed with fibre. The lower ARPU in Germany would result in a slightly lower potential revenue.
If we assumed that more consumers were on lower tie tariffs, the current and potential revenue would of course be lower and vice versa.
Speaking of fibre ARPU, it will depend on the tariff tier split. In an example below, it varies from $19.17 PPP in Denmark to $143.32 PPP in Belgium. As we calculated this metric by dividing the total revenue based on the selected tariff tiers by the number of subscribers, the much higher number of FTTP subscribers in Denmark (more than 5-fold compared to Belgium) partly explains such a big difference in ARPU between the two countries. Also, Belgian FTTP tariffs are much higher overall, given the 2.5Gbps download speed offered on the two of them.
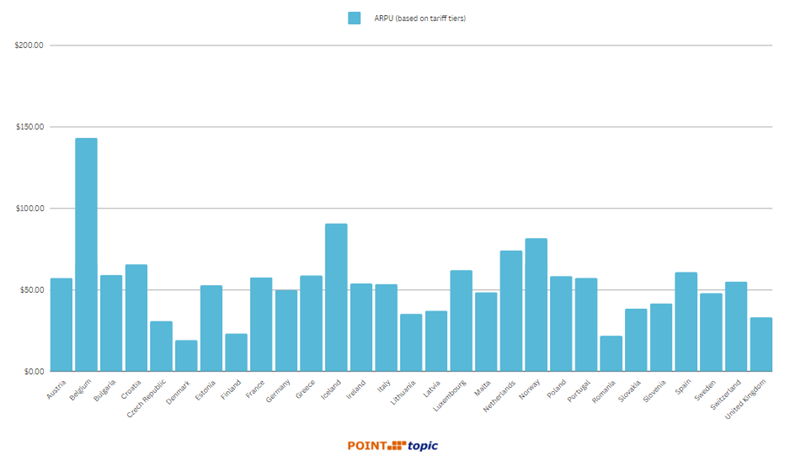
Across Europe, the average fibre ARPU with the selected tiers was $54.18 PPP.
Of course, some countries and operators will exceed or miss their fibre adoption targets and so the actual take-up of FTTP broadband services will likely be lower than 100% of households passed by FTTP networks. This model estimates the maximum revenue headroom possible.
We have made this model available publicly to demonstrate how data from different Point Topic’s services can be combined to produce various insights. See the spreadsheet attached to this report with four countries used as an example. More countries, operators, different tariff tiers, and metrics can be compared using our analytical tool available to Point Topic customers. To learn more about becoming one please contact isabelle.anderson@point-topic.com
[1] For brevity, we will be using FTTP and ‘fibre’ interchangeably to denote FTTP/H/B variants.
[3] Docsis3.0 coverage figures include the more advanced Docsis 3.1.
[4] Unlocking the Gigabit Dividend, Frontier Economics, August 2022.
[5] The UK’s TV, Streaming and Broadband Market: cost of living crisis challenging bundled synergies, Point Topic, 2022.


Comments