FTTP broadband subscribers to reach 1.2 billion in top 30 markets by 2030
- Jolanta Stanke

- Dec 5, 2025
- 11 min read
We have completed our latest forecasts for fixed broadband subscribers by technology. They are based on our Global Broadband Subscriber figures for up to Q2 2025. For the methodology of the forecasts, see the final section of this analysis. The complete dataset referred to in this analysis is available to our our Global Broadband Statistics (GBS) and European Broadband Statistics subscribers.
By 2030 we are projecting a total of 1.54 billion subscribers to a fixed broadband connection in the 30 largest broadband markets in the world, compared to 1.33 billion in Q2 2025. Full fibre (FTTP), which is already a dominant technology in most of the markets, will be the preferred option for most consumers, where it is available.

Split by technology we estimate that by 2030 there will be about 1.22 billion FTTP, 152.5 million cable, 56.6 million FTTX, 82.7 million FWA, 10.2 million satellite and 24.4 million DSL lines in these markets (Figure 1). Compared to our previous forecast, we increased FTTP and cable lines forecast while lowering the forecast of FTTX and DSL lines. These changes are based on the latest growth trends and some changes in FTTP reporting in some markets (India and Australia, for example).
Also, we added more countries to our FWA and satellite forecasts, as the figures became more significant and easier to estimate. Our previous FWA forecast only included three countries, while the current one features eleven (with significant numbers of (5G) FWA connections). Likewise, our current forecast includes satellite broadband connections in nine countries, as opposed to none in the previous forecast.
Between 2025 and 2030, we project a 16% growth in total fixed broadband subscribers in the top 30 markets (Figure 2). Most of the net additions will come from FTTP, but growth in (5G) FWA will be far stronger in percentage terms. We expect FTTP lines to increase by around 23% (+231 million), whereas FWA lines will more than double (rising from 32 million to 83 million).

We expect cable[1] broadband lines to shrink by around one‑fifth (19%) by 2030 as operators migrate customers to full fibre. The DOCSIS4.0 standard can deliver fibre‑like speeds but we think it will be deployed only in limited markets.
FTTX connections (where fibre is present in the local loop with copper, mainly fibre to the cabinet) will shrink by 28% as operators replace legacy networks with full fibre. The decline will be slower in the markets where legacy infrastructure is still wide‑spread. FTTX will remain a competitive option even where other technologies are available as it still offers enough bandwidth to some households.
DSL will see the steepest decline (-42%), mainly serving small or older households that are reluctant to upgrade, or those who have little choice of affordable alternative broadband technologies.
We project that satellite broadband connections will almost double thanks to Starlink as well as other current and emerging projects such as HughesNet, Amazon Leo (formerly known as Project Kuiper), and Eutelsat / OneWeb. Satellite broadband it is becoming a real alternative, especially where fibre or FWA are absent.
[1] Cable is a term we use as a proxy for those legacy operators (e.g. VMO2, Charter, Comcast) that still have significant networks based on coaxial cable, mainly DOCSIS3 and 3.1.
Regional Breakdown of Broadband Subscribers
Fixed broadband penetration of premises will increase across all regions by 2030 (Figure 3). We forecast that Africa—where fixed infrastructure is still relatively limited— will reach 59% penetration by 2030 (up from 46% in 2025), representing the largest gain among the regions. The Americas are projected to reach 90% penetration, Asia nearly 80%, while Europe and Oceania will hover in the mid‑90s as many markets are already near saturation.

FTTP will drive broadband subscriber growth in most markets. It already claims the highest premises penetration in the Americas, Asia and Europe and is set to become the dominant technology in Oceania by the end of this decade. In Africa, FTTP deployment, driven by Egypt and Algeria, is in early stages and the region is forecast to reach 22% penetration by 2030 (based on the largest regional markets). So, copper and other legacy technologies will continue to be important.

In the Americas, FTTP displaced cable as the dominant technology in early 2025, with the largest markets of the United States, Brazil and Mexico leading the way in terms of forecast FTTP subscribers by the end of the decade. FWA will also see a significant growth with the connections more than doubling, led by the giants T-Mobile, Verizon and AT&T in the US. The US, Canada, Mexico and Brazil will be responsible for the projected 61% growth in satellite broadband connections.

FTTP will dominate in Asia in terms of total numbers and penetration, with many countries in the region having large populations and abundant potential new subscribers, although mobile technologies remain an important alternative method of broadband access. As a result of active investment in FTTP in China, India, Indonesia, Vietnam and the Philippines among others, FTTP broadband connections in the region will grow by 17%.
Asia will also see a dramatic growth in 5G FWA connections, with their number nearly quadrupling, mainly due to aggressive investment by the Indian operators Reliance and Bharti Airtel.

Europe will see decline in copper broadband connections (DSL by 85%, FTTX by 38%). Despite already high broadband penetration, we expect full fibre take-up to increase by 51%, as network coverage and choice expand further and consumers migrate from legacy networks, including cable. Satellite connections will almost double to serve hard to reach areas, with FWA also growing by 61%.

Our analysis of Oceania is based on Australia (the only country from the region in the top 30 largest markets category). Here, we forecast that FTTP lines will more than double between 2025 and 2030 (+123%), with the government placing renewed focus on investing in full fibre. In the same period, FTTX (FTTC and FTTN) and cable (HFC) will be on the way out, while DSL will almost completely disappear. FWA and satellite will also see a healthy growth, with Australia being one of the largest markets for Starlink.

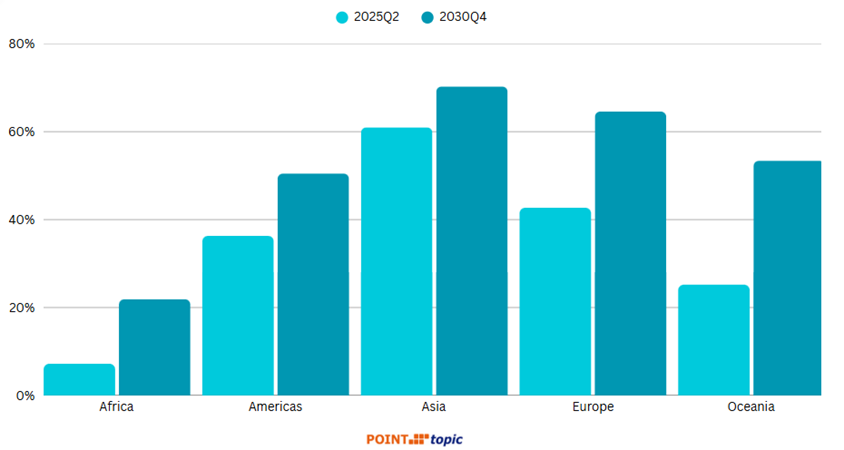
Asia is expected to have the highest regional FTTP penetration by 2030, with 70% of households and businesses subscribing to a full fibre service (figure 9). As we mentioned earlier, China is the main driver but rapid progress in terms of fibre deployment is also being made in other markets. Having said that, some countries in the region are still relying on legacy infrastructure.
Europe will follow closely, with 65% of premises forecast to have full fibre access in 2030. The EU has several major policies, funding programmes, and regulatory frameworks designed to accelerate the deployment of full-fibre and other gigabit-capable networks. There are a number of national fibre programmes, enabled by these initiatives, notably the THD Plan in France (one of Europe’s largest rural fibre builds), Gigabitstrategie in Germany (FTTH rollout to all households and businesses in cities and rural areas), and Piano Italia a 1 GIGA in Italy (gigabit coverage in underserved areas). Spain has already said already shut down its copper network, with more than 90% of all fixed broadband connections using fibre.
In the Americas, FTTP will overtake cable broadband in all markets except the US, where the strength of the ‘cable’ sector means it will see a slower decline compared to other regions, although we project that the country will see a 51% growth in FTTP connections between 2025 and 2030.
Country View
All the 30 largest markets will see higher fixed broadband penetration by the end of the decade, with China, United States, India, Brazil and Japan projected to have the highest numbers of connections. China Is the largest broadband market today and will remain so at the end of the decade[1].
[1] China exceeds 100% household broadband penetration because the metric counts subscriptions, not unique homes. Many households maintain multiple broadband lines, and millions of dormitory rooms, multi-tenancy apartments, and microbusiness connections are counted as residential accounts. As a result, subscriptions can legitimately exceed the number of census households.

In terms of fixed broadband penetration, we project India to have the lowest percentage of premises with a broadband connection, at 34% (up from 15% in mid-2025) and the most headroom available (more than 250 million) while many of the largest 30 markets will approach 100%. (See the above footnote on China).

We expect penetration above 90% in 16 out of the 30 markets (mainly developed or fast-growing economies), so headroom and potential for signing up new customers will shrink in these countries. Broadband providers in these markets will have to try to convert existing customers to higher bandwidth and more competitively priced broadband tariffs.
China, Vietnam, Spain and South Korea will lead in terms of FTTP penetration of premises.

FTTP – the Only Way is Up
We have been tracking FTTP around the world since 2011, which allowed us to produce more accurate projections with good timelines to train models on. As we can see from analysis, FTTP will become the dominant platform in the majority of the largest broadband markets at the expense of the other technologies.
In Asia, we can see gentle curves in many of the mature markets (Japan, South Korea, Taiwan) where FTTP has been available for some time. Vietnam is approaching saturation because it effectively skipped the copper/DSL era and deployed FTTH directly, helped by very low deployment costs, dense urban areas, and fierce competition among ISPs. With weak cable TV infrastructure, strong government support for digital infrastructure, and fibre also needed for mobile backhaul, operators rapidly rolled out fibre nationwide.
India, Indonesia, the Philippines and Iran will be most active markets in the second half of the decade, with Turkey and Thailand also seeing significant growth in FTTP connections.

In Europe, Spain, France and Romania are approaching maturity in terms of fibre broadband connections. At the other end of the spectrum, Belgium, Germany and Italy still have a significant way to go - there is still a lot of potential there to migrate subscribers from legacy platforms to FTTP. Also, the former two countries still have to make progress to bring FTTP coverage to the majority of their populations, with their current fibre availability below the EU average.
In the UK, FTTP subscribers have now overtaken FTTC, and FTTP take-up is forecast to accelerate as 'full fibre' becomes the best and most affordable option for the majority of households.

The Americas, dominated by the US and Brazil in terms of the scale of FTTP connections, will see accelerating growth in the second half of the decade. While the established cable market will temper FTTP growth in the US, fibre providers have a large potential market. In the rest of the region, the potential is even greater, with fixed broadband penetration in Mexico, Argentina and Colombia still well below saturation and the investment in full fibre accelerating.

Outlook and Implications
By 2030, the fixed‑broadband landscape in the top 30 markets will look very different from today. The number of subscriptions will climb to about 1.54 billion, up 16% from mid-2025, and full fibre will account for most of the growth. We forecast around 1.22 billion FTTP connections, alongside 153 million cable/HFC, 57 million FTTX, 83 million FWA, 10 million satellite and 24 million DSL lines. FWA will record the fastest growth rate, more than doubling from around 32 million lines in 2025, while legacy DSL and copper‑based platforms will continue to shrink dramatically as customers migrate to fibre.
Fixed‑broadband penetration across these markets will rise from 72% in mid-2025 to nearly 83% in 2030. Arica will record the largest gain, reaching about 59% of premises passed, up from 46% today. The Americas and Asia will see penetration climb to 90% and 80% respectively, while Europe and Oceania will near saturation at above 94%.
FTTP penetration will top 70% of premises in Asia and 65% in Europe (in the selected markets included in this analysis). It will increase to over 50% in the Americas, 53% in Oceania, and 22% in Africa. China, India and the United States will have the largest number of FTTP connections by the end of 2030. The highest FTTP penetration will be in China, Vietnam, Spain and South Korea.
Cable / HFC networks will also still have a part to play in the markets where they are well established, while copper still has life in it in the less developed markets, in particular in Africa. Satellite and (5G) FWA are gaining momentum in many markets, in the areas where fixed solutions are not feasible or fibre and cable are becoming less competitive in terms of pricing.
In terms of overall fixed broadband take-up growth, it will mainly come from the ‘youthful’ markets with current low or medium penetration, with plenty of consumers in India, Indonesia, Thailand and other fast-growing economies hungry for reliable high bandwidth connections. As to more mature markets, where fixed broadband penetration is already high, we will see higher growth of subscriptions to certain broadband technologies at the expense of others, for example consumers migrating from cable and FTTx to FTTP and 5G FWA.
The complete dataset referred to in this analysis is available to our Global Broadband Statistics (GBS) and European Broadband Statistics subscribers.
Appendix: Sources and Methodology
We have forecast fixed broadband subscribers by technology in the top 30 global markets[1] for the period ending Q4 2030. The aim of the forecast is to predict which broadband technologies will come to dominate in the largest broadband markets, perhaps at the expense of other fixed or mobile technologies.
The main input to the forecast is Point Topic’s Global Broadband Subscriber (GBS) data, collected and estimated quarterly at the operator and country level. For the purposes of this forecast we used the GBS data covering the period between Q4 2011 and Q2 2025. Other inputs included operator and regulator announcements about broadband network deployment plans and targets for the next 5-10 years, as well as the economic and demographic factors.
The initial stage of forecasting was completed using one of the two models:
Logarithmic function: ln_x = np.log(x)
Logistic function: L / (1 + np.exp(-k*(x-x0)))
For each country and technology combination we selected one of the models that best fit the existing data and trends in broadband subscriber figures.
In the next stage, the model outputs were adjusted, where necessary, taking into account network deployment announcements and the number of premises in a country (upper limit). The forecast number premises was based on the UN population estimates and projections[2] and UN Household Size and Composition data[3].
Technologies covered and caveats
Our forecast covers the main fixed broadband technologies:
DSL (mainly ADSL but including VDSL in some cases)
Cable (including Docsis3.0 and Docsis 3.1)
FTTP (FTTH/B)
FTTX (mainly VDSL, but also other variants of fibre-to-the-X)
(5G) FWA (selected countries)
Satellite (selected countries)
The variations on which technology group includes VDSL (DSL or FTTX) depend on the reporting be regulators/ operators across the countries.
We forecast FWA and satellite figures only in the countries where they are significant.
For more details and caveats consult the following table.
Table 1. Countries and technologies covered in the forecast
Country | Technologies | Notes and caveats | |
Algeria | DSL, FTTP, FWA |
| |
Argentina | DSL, Cable, FTTP | DSL includes a small number of VDSL lines | |
Australia | DSL, Cable, FTTP, FTTx, FWA, satellite | FTTH and FTTx split estimated; FTTx includes VDSL | |
Belgium | DSL, Cable, FTTP, FTTx | FTTx = VDSL | |
Brazil | DSL, Cable, FTTP, FTTx, FWA, satellite | FTTx = VDSL | |
Canada | DSL, Cable, FTTP, FTTx, FWA, satellite | FTTx = VDSL | |
China | DSL, Cable, FTTP, FTTx | FTTx = VDSL | |
Colombia | DSL, Cable, FTTP, FTTx | FTTx includes VDSL | |
Egypt | DSL, FTTP | DSL includes some VDSL | |
France | DSL, Cable, FTTP, FWA, satellite | DSL includes VDSL | |
Germany | DSL, Cable, FTTP, FTTx, FWA, satellite | FTTx includes VDSL | |
India | DSL, Cable, FTTP, FTTx, FWA | FTTx includes FTTx+LAN | |
Indonesia | Cable, FTTP | FTTx = VDSL | |
Iran | DSL, FTTP, FWA |
| |
Italy | DSL, FTTP, FTTx, FWA, satellite | FTTx = VDSL | |
Japan | DSL, Cable, FTTP | DSL includes VDSL | |
Malaysia | DSL, FTTP | DSL includes VDSL | |
Mexico | DSL, Cable, FTTP, satellite | DSL includes a small number of VDSL lines | |
Netherlands | DSL, Cable, FTTP, FTTx | FTTx = VDSL | |
Philippines | DSL, FTTP, FWA, satellite | DSL includes a small number of VDSL lines | |
Poland | DSL, Cable, FTTP, FTTx, FWA | FTTx = VDSL | |
Romania | DSL, Cable, FTTP | DSL includes VDSL | |
South Korea | DSL, Cable, FTTP | DSL includes VDSL | |
Spain | Cable, FTTP | DSL includes VDSL | |
Taiwan | DSL, Cable, FTTP | FTTP included some VDSL in earlier periods | |
Thailand | FTTP, FTTx | FTTx includes VDSL | |
Turkey | DSL, Cable, FTTP, FTTx | FTTx = VDSL | |
UK | DSL, Cable, FTTP, FTTx | FTTx includes VDSL and G.fast | |
US | DSL, Cable, FTTP, FTTx, FWA, satellite | FTTx = VDSL | |
Vietnam | DSL, Cable, FTTP | Very little VDSL in Vietnam |
[1] Excluding Russia


Comments