UK broadband availability in Q2 2025: FTTP approaching 80%
- Jolanta Stanke

- Aug 5, 2025
- 5 min read
This is our regular update on fixed broadband availability in the UK, tracking the progress to the end of Q2 2025. The analysis is based on our broadband availability dataset which covers all 1.7m UK postcodes. More granular, postcode level broadband availability updates by operator and technology, are available to our UK Broadband Mapping customers. Also, for a limited time, we made our comprehensive Local Authority level data and Ward level maps available for free here.
Note: There will generally be a lag to the operator announcements for premises passed at the time since it takes us time to properly track and audit any new deployments, unless the operators tell us about them. Also, we report RFS (ready for service) premises, while some operators and ISPs include premises where customers can pre-order a broadband service.
Key headlines
At the end of Q2 2025, FTTP coverage was 77.8% of the UK premises, compared to 75.8% at the end of Q1 2025. The number of FTTP premises went up 15.3% y-o-y.
10.9 million premises had access to two or more FTTP networks (32.6% of all UK premises). Just over 1.75 million premises were covered by 3+ fibre networks.
Legacy networks operated by Openreach still covered 14.3 million premises, but this figure is now lower by 4.3 million than that of their FTTP premises.
Barnet and Barnsley local authorities added most FTTP premises in Q2 2025 (14.9K and 14.2K respectively).
Nationwide 2 million premises could choose between two or more fibre altnets, compared to 1.9 million in Q1 2025, with altnet overbuild slowing down.
Openreach and FTTP in general
In Q2 2025, we recorded 982.5K additions to the full fibre premises passed by Openreach. Our total Openreach FTTP footprint stood at 18.7 million premises, up 5.6% quarter-on-quarter (Table 1). Openreach full fibre now covers 55.6% of all UK premises, up from 52.7% in Q1 2025.
The decline in the number of Openreach ADSL, FTTC and Gfast only premises continued – their number went down by 977K, only slightly lower than the FTTP additions. Non-fibre networks still covered 14.3 million premises in the UK, though this number has decreased by 6.4% quarter on quarter, and it is now by 4.3 million lower than that of FTTP premises.
Table 1. Openreach footprint by technology, Q2 2025. Source: Point-Topic.

Openreach FTTP continues to have the highest FTTP coverage in local authorities outside London and the South East. Similarly to the past quarters, among the top 20 LAs by this measure, nine are in Northern Ireland (Figure 1). Belfast remains the leading local authority in terms of the availability of Openreach fibre, with 96% of its premises passed. Causeway Coast and Glens are at the bottom of the top twenty LAs with 86%.

In Q2 2025, the overall FTTP coverage, including Openreach FTTP network, altnets, Virgin Media O2’s fibre network and KCOM was just over 26 million premises (77.8% of the UK total, compared to 75.8% at the end of Q1 2025). The number of FTTP premises went up 15.3% y-o-y, with the growth slowing down as full fibre coverage approaches 4 out of 5 of the UK premises.
Fibre network overbuild has increased further. At the end of Q2 2025, 10.9 million premises had access to 2 or more FTTP networks (32.6% of all UK premises, up from 30.1% in Q1 2025). Just over 1.75 million premises were covered by 3+ fibre networks, with this number having increased by 12.4%.
Table 2.Comparison of FTTP network overbuild (all networks). Source: Point Topic.

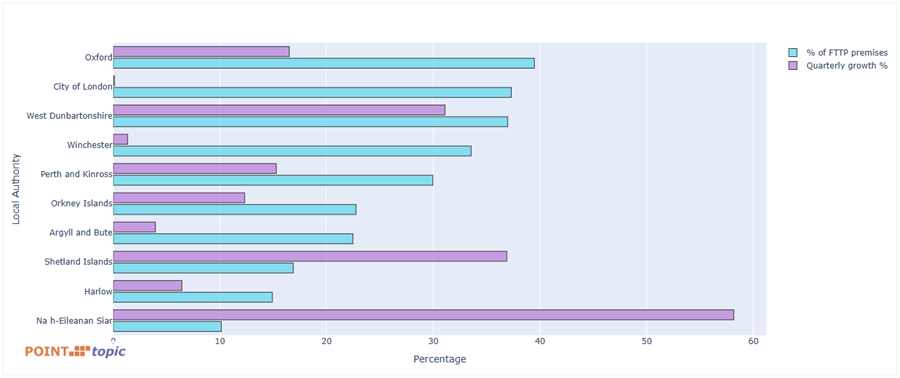
The continuing FTTP deployment by multiple operators also had an impact on our ‘list of shame’ which shows the bottom ten UK local authorities (LAs) by FTTP coverage (Figure 2). Most areas in this category experienced noticeable quarterly growth, with Na h-Eileanan Siar showing the most significant change (58% up quarter-on-quarter), rising from 6% to 10% premises passed. Oxford and West Dunbartonshire also demonstrated notable quarterly improvements, with FTTP premises in Oxford increasing from 34% to 39.5% and in West Dunbartonshire from 28% to 37% of all premises.
In Q2 2025, Barnet and Barnsley added most FTTP premises (14.9K and 14.2K respectively), while Birmingham saw a slower increase than before (+11.6K), with 83% of premises in this LA already covered by FTTP (Figure 3). In the top ten by premises added category, Enfield, which added 9K FTTP premises, has the longest way to go, with only 45% of its premises having access to FTTP.

The overall picture of FTTP premises added across the UK can be seen in the following map.

Nationwide, several local authorities experienced notable % growth in FTTP premises, with standout increases including Na h-Eileanan Siar (58.2%), Shetland Islands (36.9%), West Dunbartonshire (31.1%), South Tyneside (25%), Tamworth (23.9%), and Castle Point (21.1%).
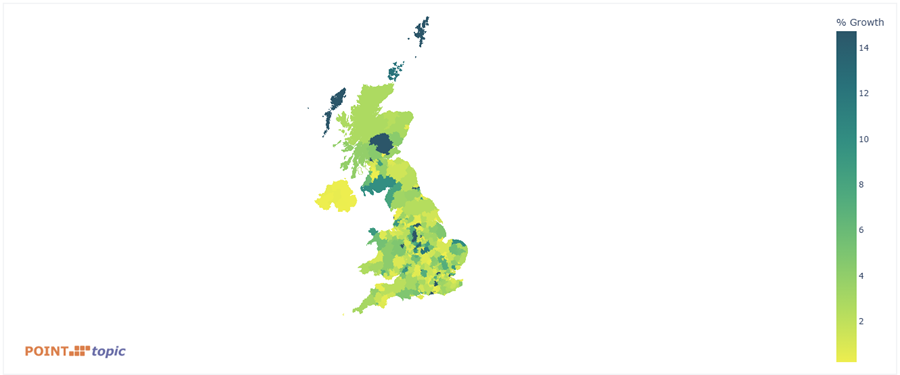
Large metropolitan areas like Birmingham, Glasgow and Leeds saw moderate expansion (2.8%, 0.9% and 0.6% respectively), but their FTTP coverage is already above 80%.
Fibre Altnets
Among the altnets exceeding 100K fibre premises passed, CityFibre remained at the top of the league with 4.1m FTTP premises covered by their network (Ready for Service premises). Netomnia (including brsk), nexfibre, and Community Fibre had the next largest footprints with 2.5m, 1.8m and 1.4m premises respectively (Figure 6)[1]. Netomnia, which is in the process of integration with brsk, have recently updated their premises passed target from to 3m by the end of 2025 to 5m by the end of 2027, aiming to become one of the largest FTTP networks. (Note: our chart still displays Netomnia and brsk figures separately).

[1] See our earlier note about possible lags to the operator announcements of premises passed.
Quarter-on-quarter, we recorded the largest percentage growth in FTTP footprint for Quickline (25.3%), brsk (13.3%) and LightSpeed (12.8%) (in the 100K+ premises category).
Overbuild by FTTP altnets has increased slightly, as most operators slowed down network rollouts to focus on commercialisation. In Q2 2025, nationwide 2m premises could choose between two or more fibre altnets, compared to 1.9m in Q1 2025. Nearly 193K premises were served by 3 or more alternative fibre networks, up from 179K three months earlier (Table 3). We are expecting overbuild to slow down further as market consolidation increases. In most recent news, CityFibre announced acquisition of Connexin, a fibre altnet with presence in parts of East Yorkshire, Nottinghamshire and Lincolnshire.
Table 3. Altnet overbuild evolution. Source: Point Topic.

The complete dataset used to produce this analysis is part of our UK Broadband Mapping at postcode level. You can also access our comprehensive data at Local Authority level, including broadband maps at ward level that highlight where the broadband infrastructure is in place, and where it’s still catching up. We made it freely accessible for a limited time here.
If you have any questions, you can contact us on 020 3301 3303 or by e-mail oliver.johnson@point- topic.com


Comments